

Will Bitcoin See an Early Top?
Bitcoin Data Newsletter

Hello Everyone!
There’s been a lot of discussion recently in the Crypto Twitter community of an early Bitcoin top, one that comes unexpectedly before the halving. Many of the predictions I see even call for this to happen within this year.
So then the question becomes, is this possible? How much merit do these claims hold? Or are they overly optimistic illusions of bullish fantasies? In this month’s newsletter I’m going to break this down using two of my own signature models, the November 28th Cycles Theory and the Trend Pattern Price Model.
If you like my analysis and data and want more, be sure to sign up to the Bitcoin Data Newsletter Premium. Where Bi-Weekly, I shoot out extensive, exclusive analysis that also includes access to a private general discussion Telegram Group. Premium subscribers will be the first to know of any long term buy and sell decisions I make as well as the evidence behind them. You can join us here.
Let’s dive right in.
The Early Top Argument
First, let’s explore the claim. The most logical argument I have seen in support for an early Bitcoin top, is based on the Elliot Wave Theory.
The Elliot Wave Theory says that bullish moves upward constitute an impulse wave, bearing 5 parts. Here is the basic construction of an impulse wave:
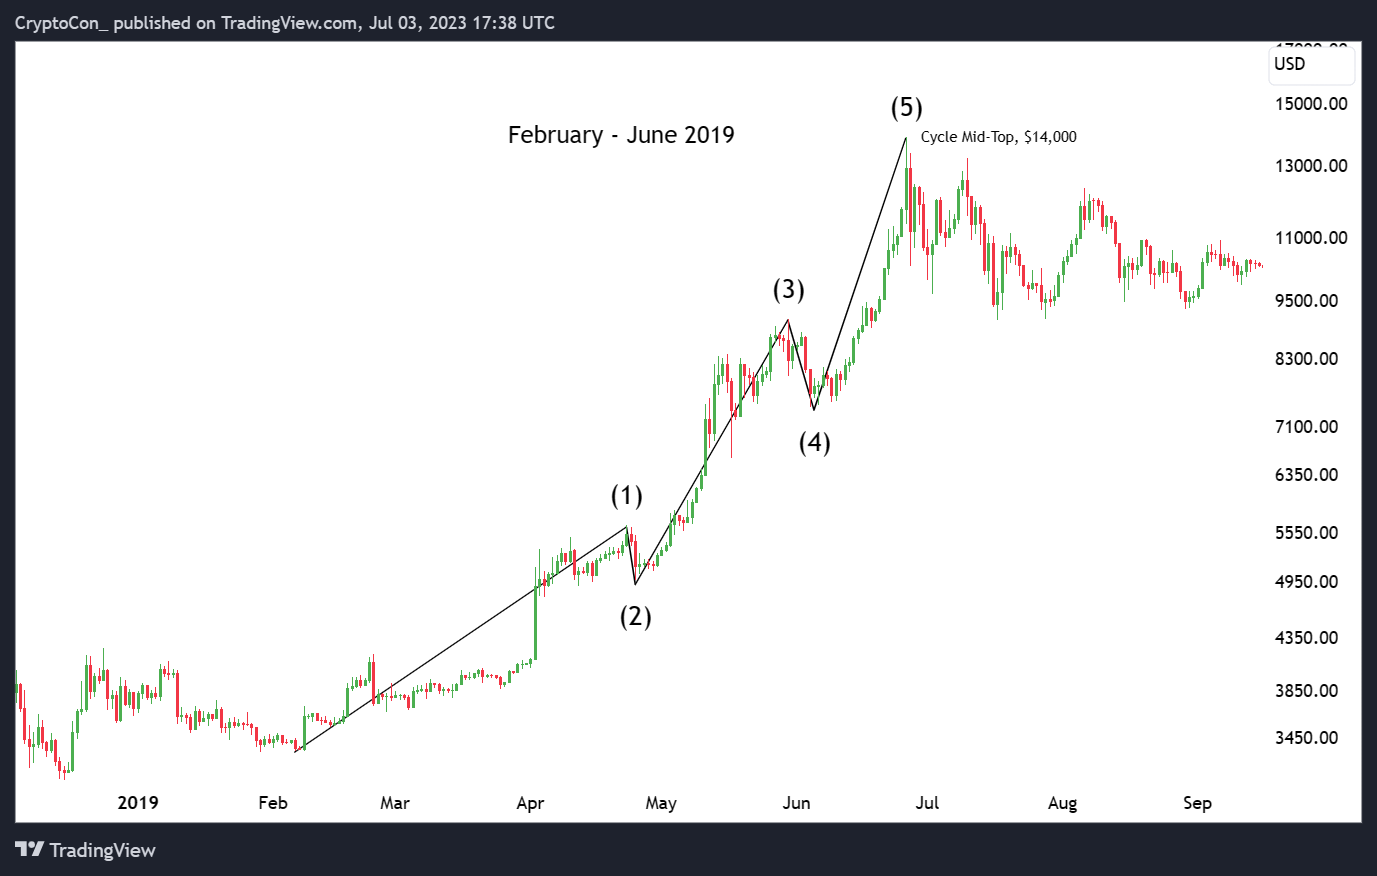
Here I have outlined what I believe to be one of the clearest examples of the Elliot Impulse Wave at work, which stretches from the Bitcoin lows of $3,000, to the Mid-Top of $14,000 in 2019. There are 3 main observable pushes which are waves 1, 3 and 5, each followed by corrections which are 2 and 4 here.
This tool can be used to determine likely tops and bottoms and is usually used in combination with the Fibonacci tool to determine price points. There are also corrective waves, sub waves, and sub waves for the sub waves which I will not get into for today’s purposes…
This impulse wave is the basis of the thought process behind an early top for Bitcoin, so let’s display how they would be seeing this:
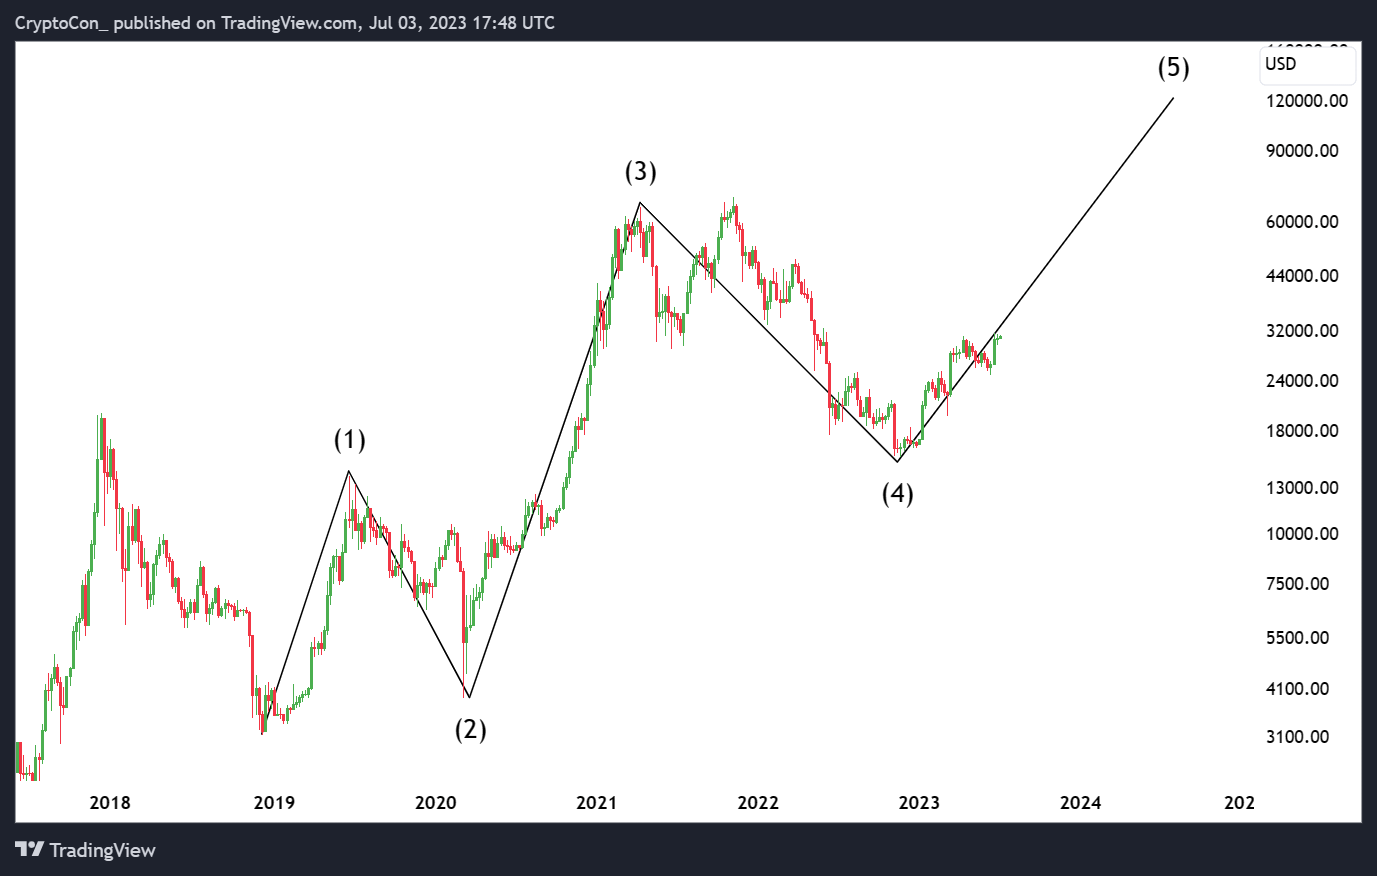
I believe there are numerous issues with this method of thinking. Elliot Wave in and of itself is not an effective tool, which is why to begin with it is usually paired with a Fibonacci tool for support.
Let me explain what I mean.
Analysis is many times subjective and can be heavily biased. In fact, you could probably make a very convincing chart to tell everyone that Bitcoin would go to $500,000 next month. The only reason people wouldn’t believe it is because they have common sense to know the probability of something like that happening is next to none.
For example, let’s say I wanted to apply this Elliot wave in a different way:
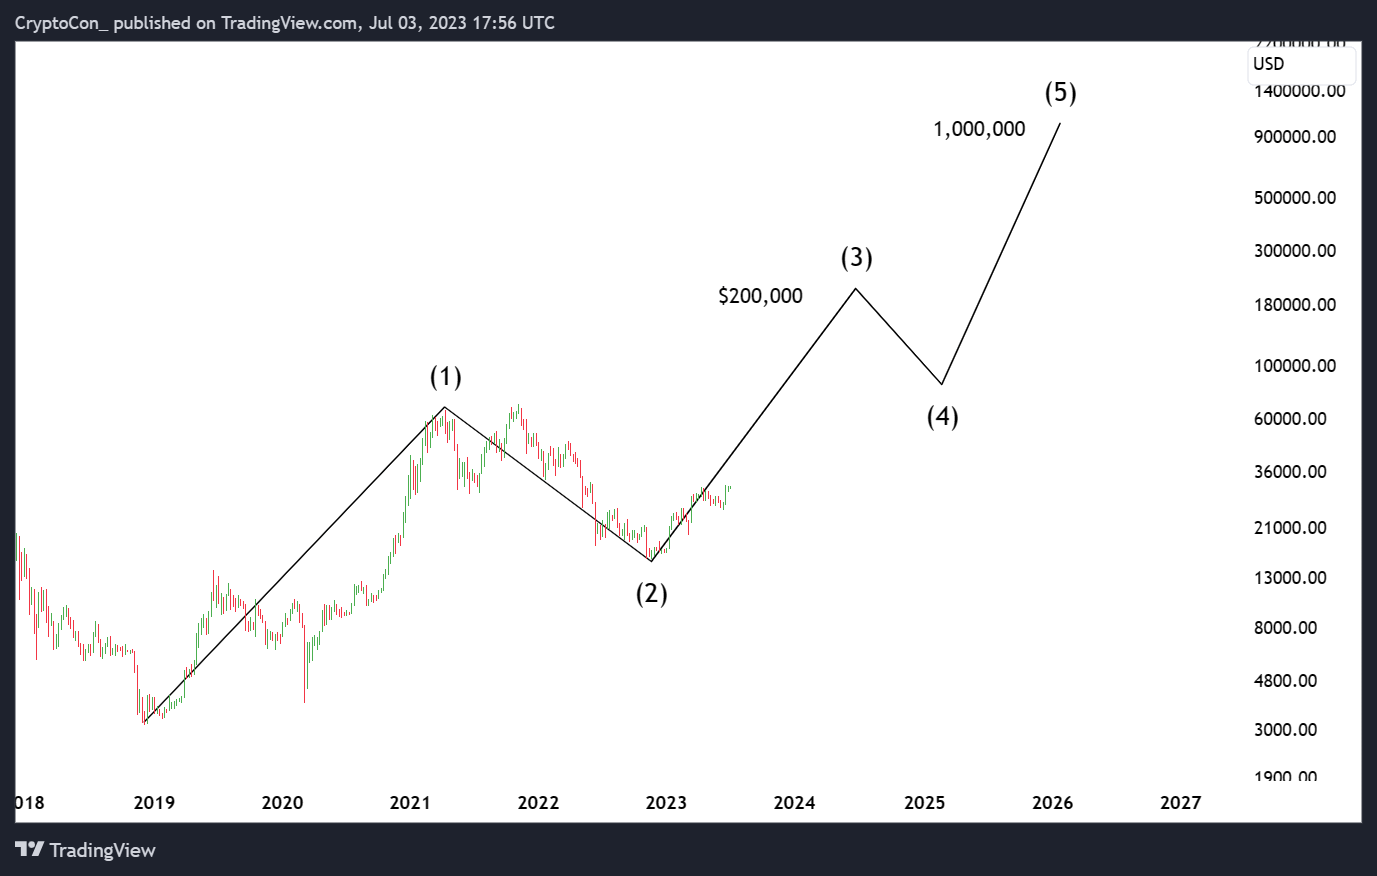
I could say that previous cycles have been suppressed, Institutions are flocking to Bitcoin in droves applying for ETFs that will likely get simultaneously approved. Asset managers will shift large portions of their reserves to Bitcoin pushing prices to 1,000,000. we are only in route to the top of wave 3.
If I throw some fancy colors and more convincing lines on the chart, I could probably persuade many people that this is true. But is it? Obviously not.
Now I want to look at a more realistic way to view the last cycle in Elliot Wave terms:
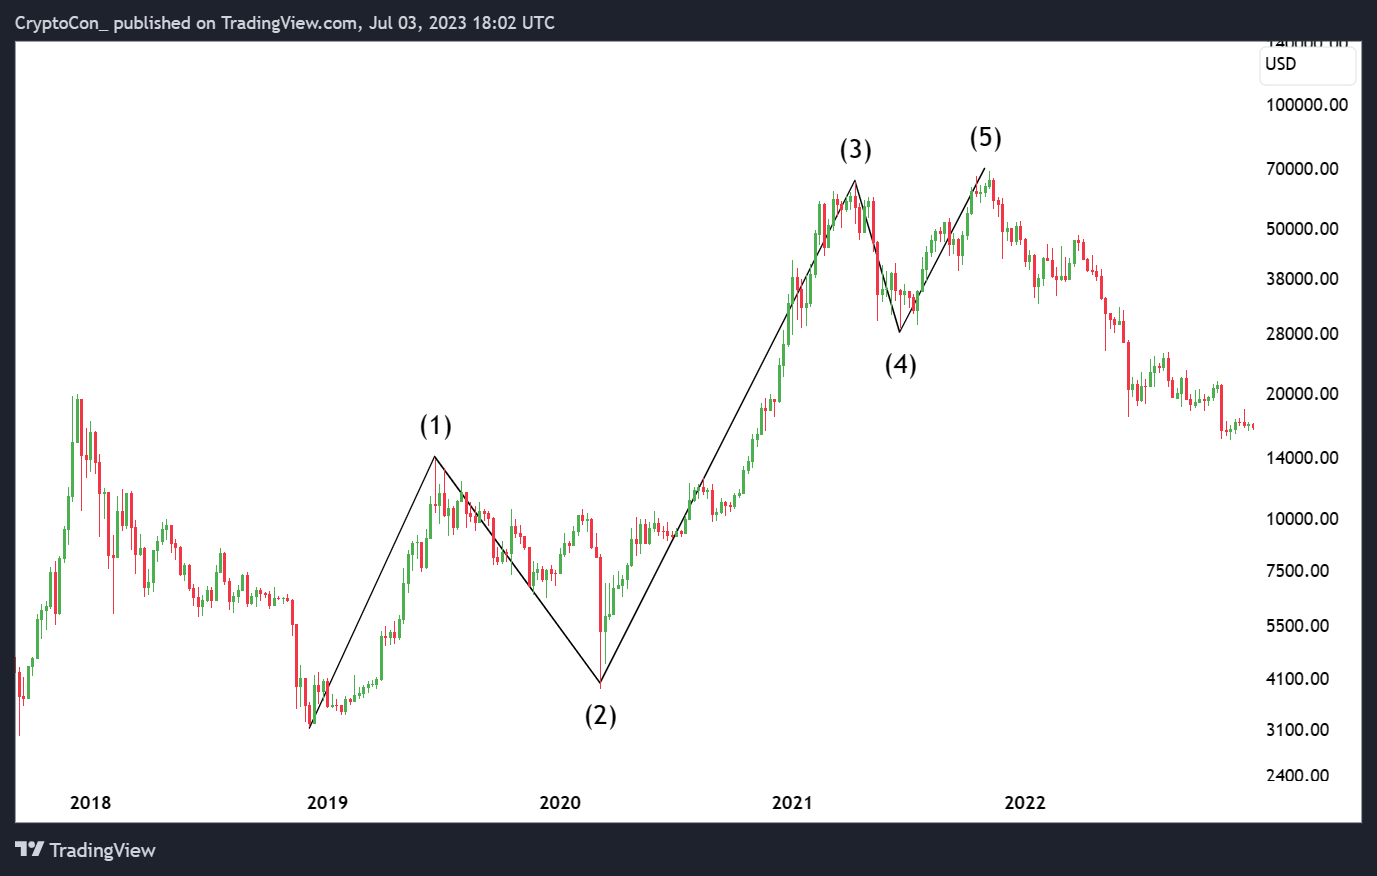
Although not a traditional wave 5, the November $69,000 top still completes the criteria. I believe the Elliot impulse wave here was captured in full, along with the cycle.
Now we bring up the other point that is made in support of this, and that is that early top believers do not believe that the last cycle has come to completion. They say that each cycle has been lengthening, up until now. There was no blow off top making it not a true cycle top.
I actually talked about this in April 2021, I think psychology played a massive role in that. Everyone was looking for a blow off top. Since the market does not cater to the majority of thinkers, it would make perfect sense for a top to play out in a stealthier way, which it did.
Not only that, but data also told us the top had occurred. On many angles. I encourage you to read my newsletter I wrote during the time, announcing my decision to sell all of my Bitcoin then. You can read that here.
The main issue I see with many conclusions, is lack of perspective and sources. I will not always be right, but I have a great track record of making good long term buy and selling decisions. Buying below 10k last cycle, selling it all in April 2021 at 54k and now having bought back in at 16.5k in November 2022. Something I encouraged everyone to do in this newsletter During the 16.5k lows.
I did this by using data from as many sources as possible, on-chain, charting, sentiment, whatever I can find. It is the key to success. When you narrow your perspectives, you become subject to imagination, and a greater likelihood of being incorrect.
TPPM and N28CT
I have posted many, many different charts from different sources and indicators, and those are good for determining when to make the decisions, but not so much predicting when the decision points will occur.
At the beginning of this cycle I created two models, one that predicts price, and one that predicts time.
Since then, these models have gained quite a bit of attention, but certainly not to the mainstream ideology as the likes of Stock to Flow. In honesty, it’s probably best that this remains true because if they are subject to massive attention, it decreases the likelihood of their accuracy. But in the end, it won’t matter, because I don’t rely on my models to make my decisions. I rely on data from countless sources for that.
That being said, I have faith in their accuracy. Not just because they’re my models, but because they’re working. And that doesn’t happen often with models. It is said, “All models are wrong, some are useful”, and for now the later happens to be true, so we will continue to observe them.
I want to take this time to go into depth on how these models work, and how they support, or do not support the thesis of an early Bitcoin top.
The Trend Pattern Price Model
The Trend Pattern Price Model uses angles measurements from peaks and lows, to find the next angle and project it outwards.
You can view the original model and Tweet here.
Here is my first iteration of this model:
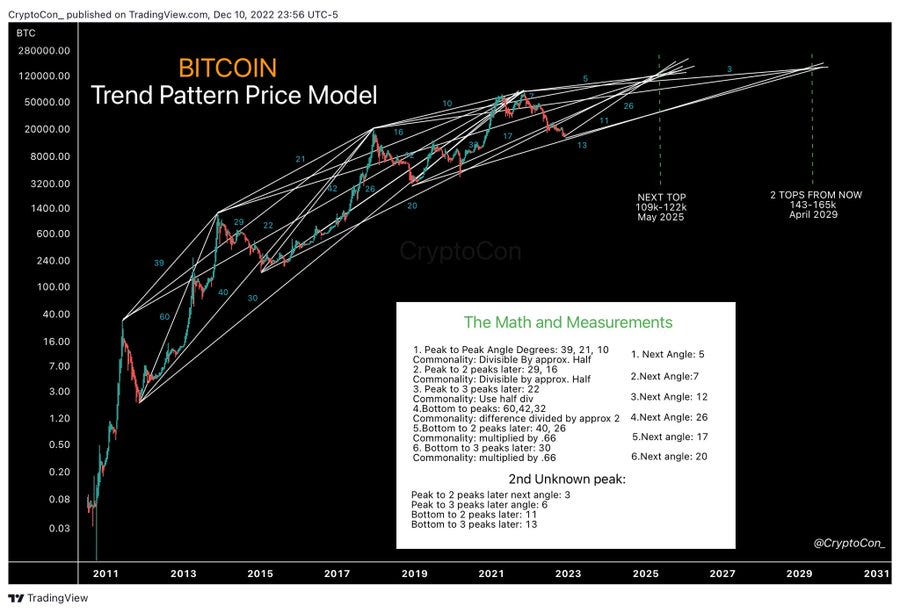
In the first model, I did not give a time frame to the next top, so I let the lines fall where they may. This gives a time frame, and price for the next cycle top. This was before I discovered the N28CT, and Afterwords, I used that models time frame to clean up the prediction and allow angles to converge around that point instead.
You can view the Tweet of the updated model here, which was posted in February of 2023.
This brings us to today’s iteration of the model which has been unchanged since then:
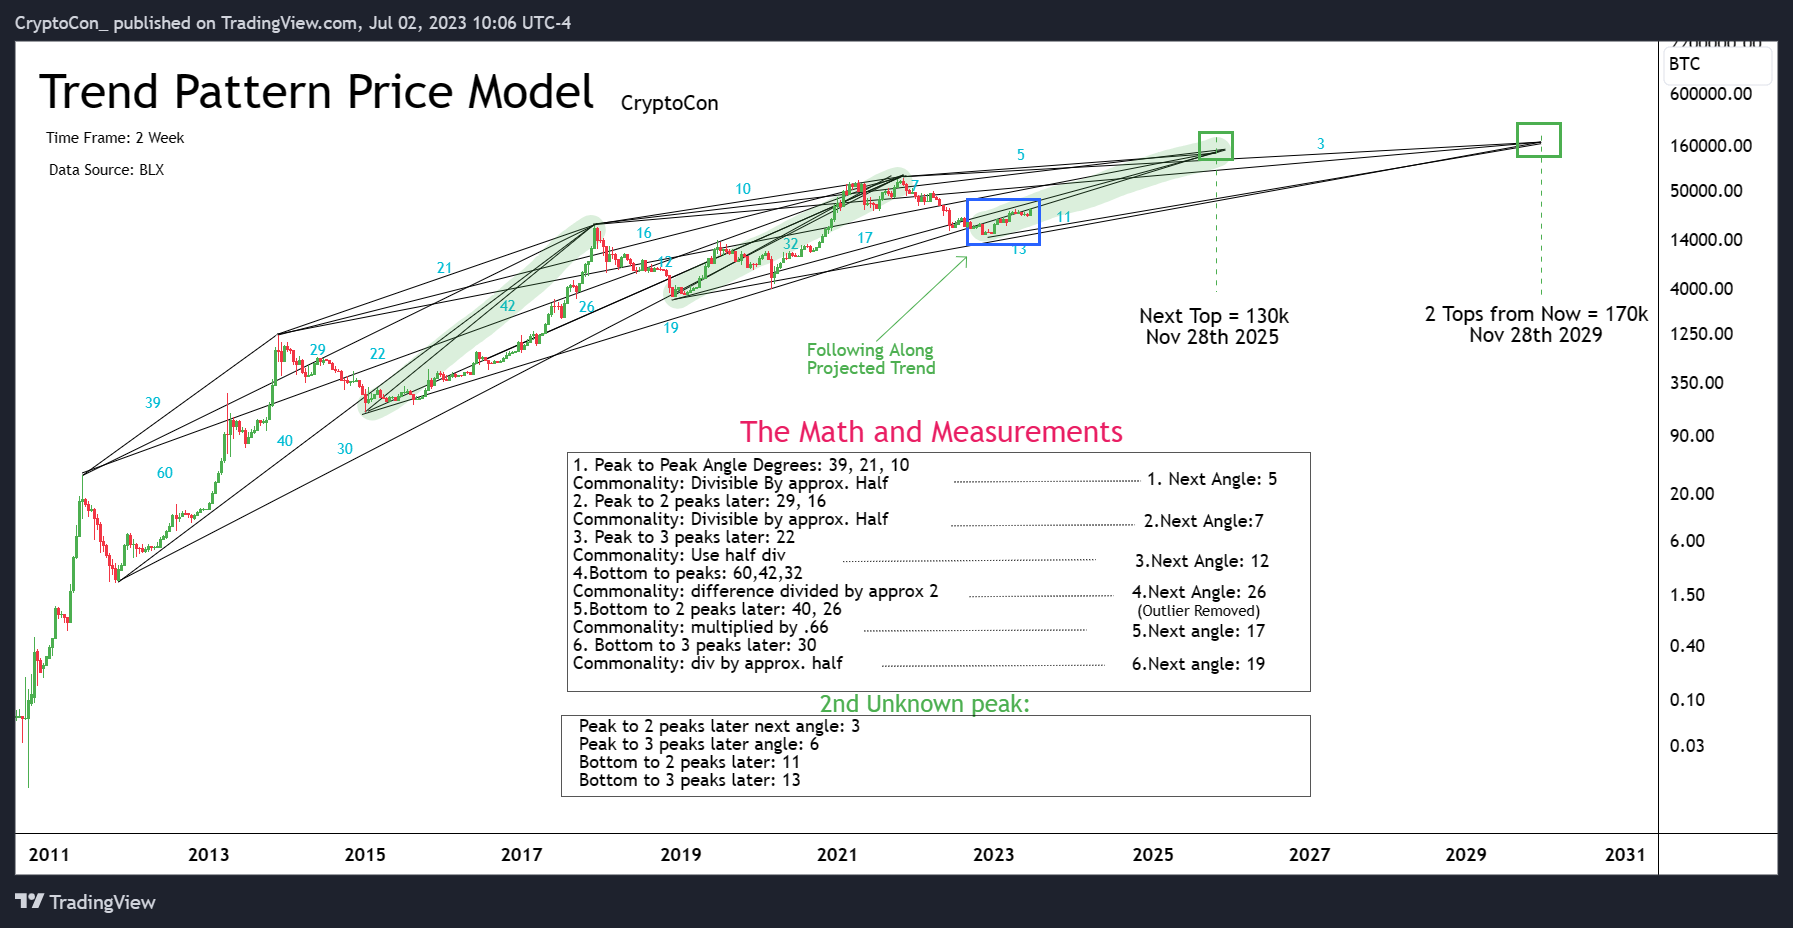
This model is a lot to take in, a lot of numbers and lines, but I believe it is important to show the full extent of the work, including the math behind it, which is mostly simple calculations.
Here is a brief way to further explain how this model works:
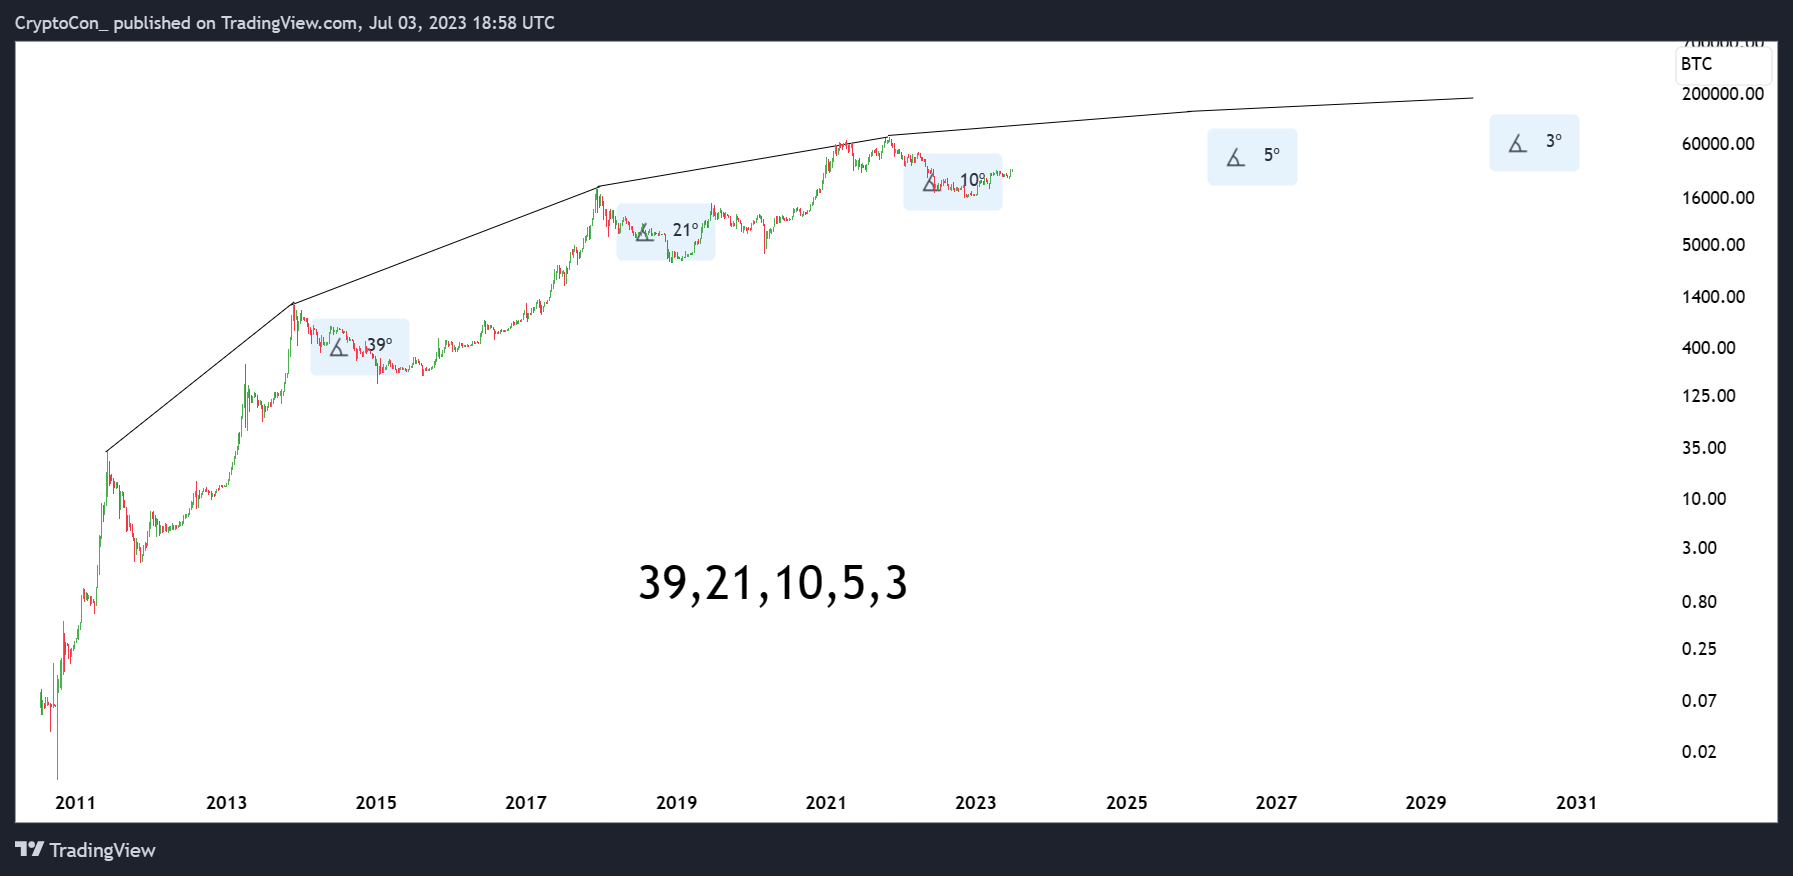
Here are the isolated angle degrees from peak to peak. If you are trying to replicate this, the angle degrees will depend on your level of zoom to the chart, but zooming does not bias confirm, as the ratios remain roughly the same.
The angle degrees from peaks are 39, 21, and 10. I then projected the last two, 5 and 3 myself. You can clearly see the pattern here, angle degrees are divided by approximately half, hence the next projections. This method was then copied to other data points, lows to lows, peak to 2 peaks ahead, and so on.
If you don’t have a time frame, the angles don’t converge as neatly, but when guided with time, you can adjust the intra-angles (less than a degree) to coincide with one another. And hence the Trend Pattern Price Model was born.
Since I created it, interestingly, price has remained right along the projected path to the top point in late 2025. Here is the model displayed again:
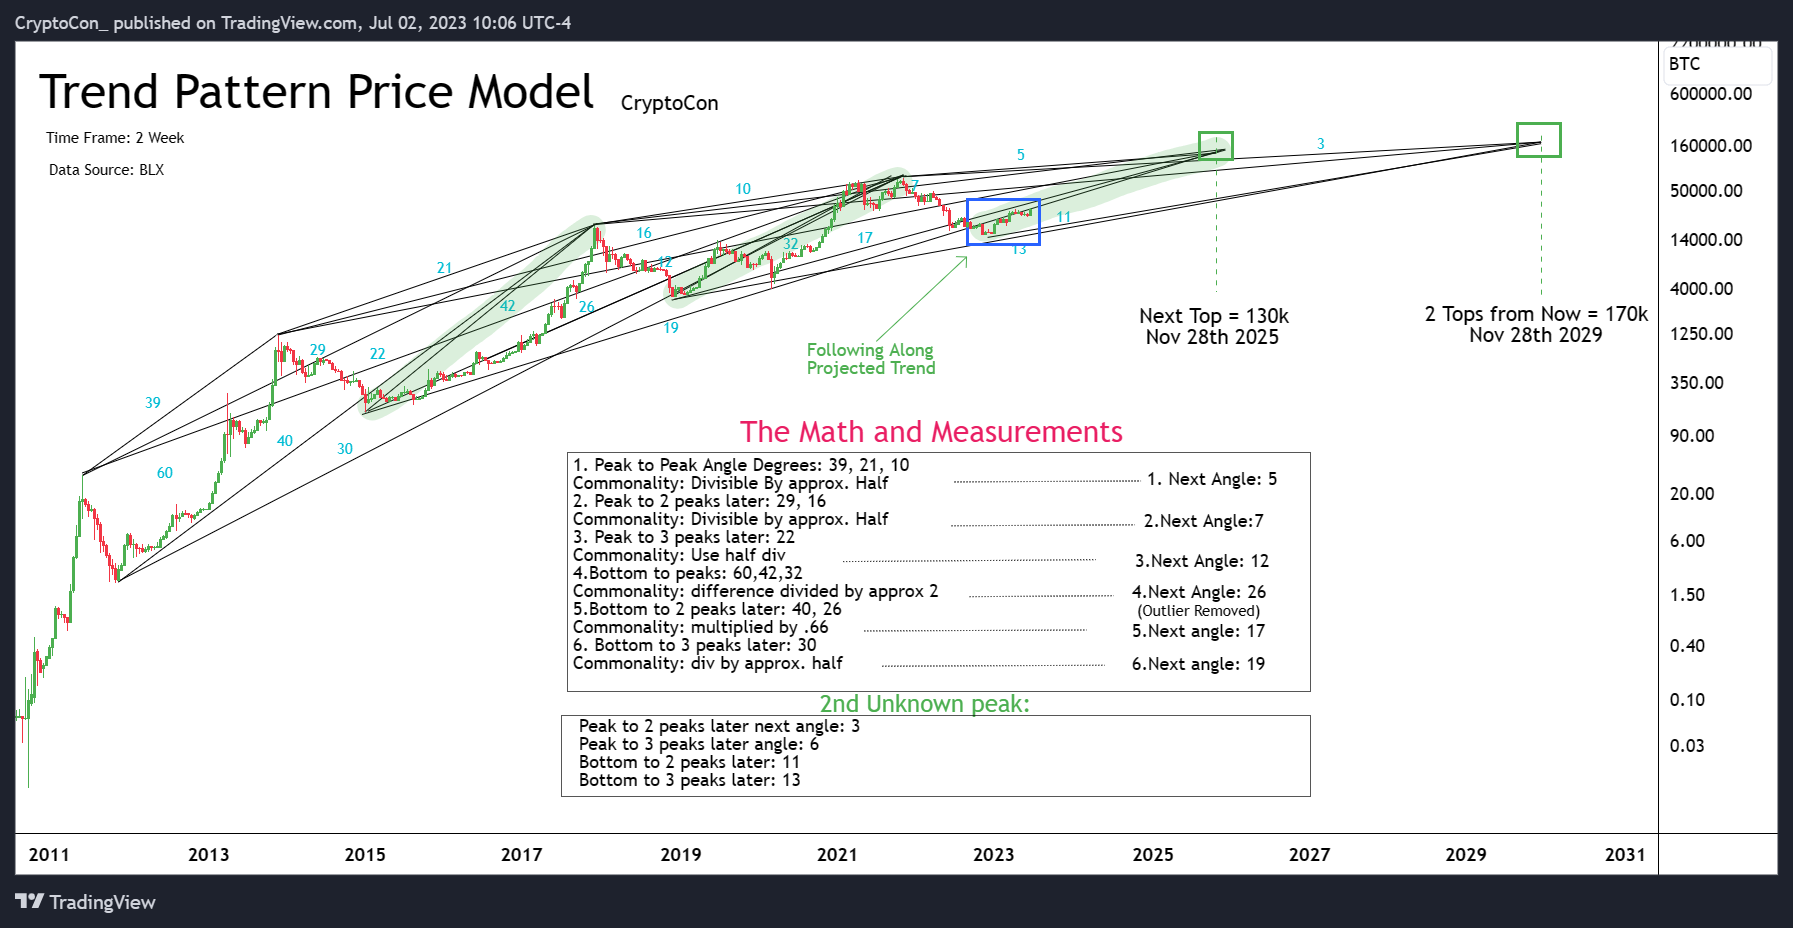
Usually, this is not the case, a curve is taken that eventually leads up into the top point.
So, is an early top possible according to this model? According to this model, not really. Price remains constrained by the upper barrier of the model which would not allow price to go well beyond the ATH until it is time. This evidence bears more weight that many other claims. Not only has price remained along the trend but look just how many data points there are to support the conclusion. I included as many as possible to avoid creating a bias.
This model calls for 130k next Bitcoin top, and 170k the top following, which has been subject to much criticism.
I must tell you I didn’t seek out the particular numbers, they were what I found through the model and math. Not to mention I consider them extremely plausible due to diminishing returns. Many people have a target in their head probably of much higher valuation, but I don’t think there’s good, founded evidence for it. Either way, we will see what comes to fruition.
In the end, I always think it’s best to stay away from certain price targets, it’s interesting to think about, but data will tell us when to act. This keeps you from a situation like many were in waiting on 100k last cycle.
So now we move over to probably my most important model, and observation.
The November 28th Cycles Theory
You can view my original Tweet and Model for the N28CT here. The Model has remained unchanged since its creation aside from a few aesthetic aspects.
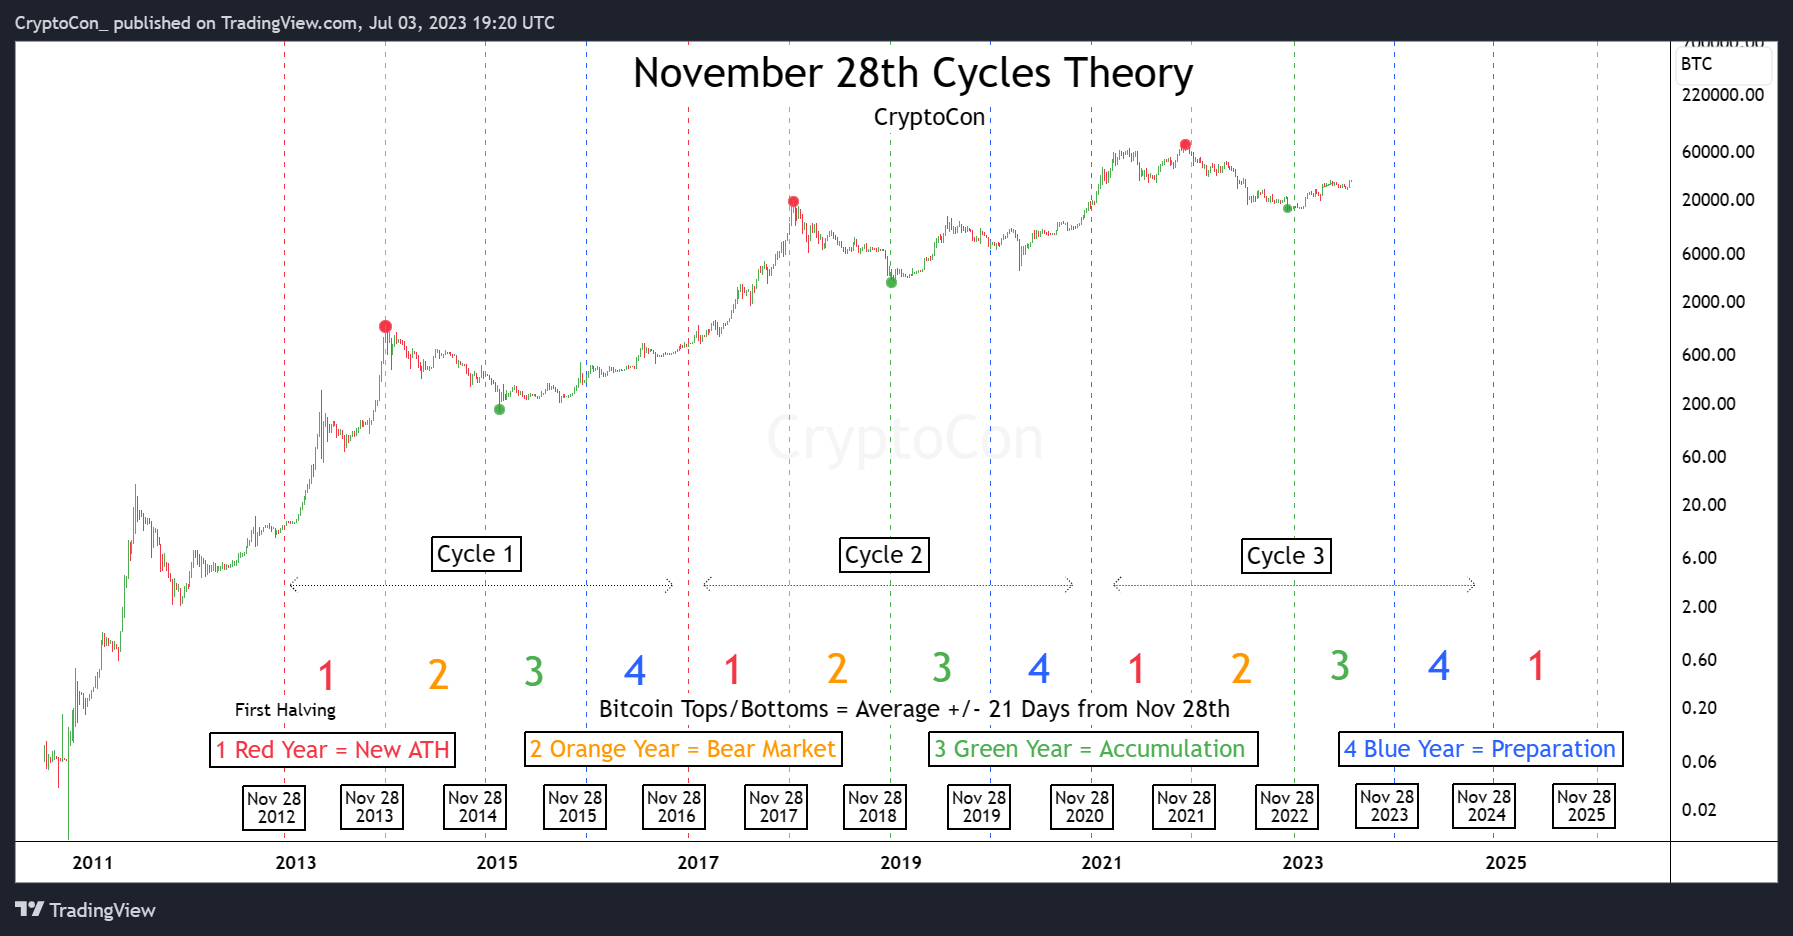
I found this model by observing the patterns created around day of Nov 28th. The model starts on the day of the first Halving, Nov 28th, 2012. I think that event triggered and actual supply shock then, when price was much more easily influenced, and caused a pattern around the date that is held in balance by structured cycles of fear and greed, halvings, liquidity and manipulation.
It supports two main ideas:
What happens between each year of Nov 28th can be predetermined based on 4-part cycles.
Tops and bottoms can be determined with an error rate of +/- 21 days.
Here are the four cycle parts:
Red Year = New ATH: New ATHs are made in this year, along with the cycle top at the end of the year
Orange Year = Bear Market: Bitcoin corrects from the highs and moves to form the new cycle bottom
Green Year = Accumulation: This year includes the best cycle buying prices, and a return to the median or fair value price which is half of the previous All Time High.
Preparation = Bitcoin establishes time at fair value, and then moves up to me new ATHs
Each top and bottom has come within +/- 21 Days of Nov 28th at the end of Red Year. which are marked by green and red dots.
This model has so far determined in real time since its creation: the bottom at 15,5k in Nov 2022 after the window had passed, and the best cycle buying prices. It now is moving towards its third prediction, which is 34,500 (median price) achieved in green year.
This model, also, does not support new all time highs or a macro top before +/- 21 days from Nov 28th, 2025.
To make new ATHs before ATH year goes against the model, and a true top before would invalidate it completely in my opinion.
Due to this model’s continued accuracy, it seems very unlikely that an early top of significance holds merit.
My Thoughts
Listen, we all want an early top. If Bitcoin went to 1,000,000 overnight, who would be complaining? But we have to stay grounded in reality. And while I do believe the “final top has not completed” argument is possible, I think of it differently.
Another piece of logic used is that these people assume that most others are thinking the 4-year cycle is the rule, and they themselves are going against the grain. That is true of sorts, but if you’re going against the grain I believe you must have a significant amount of data to prove your thesis, which to me I still have yet to see.
So how do I think this will play out? Well, if our current rate of incline continues, we might see an early top. But I believe this top will either barely, or not surpass ATHs. The former will go against one prediction of the N28CT but not destroy it.
This situation would look something like a modern day 2013 cycle according to diminishing returns. I touched on this in my last premium newsletter which you can read here.
I am confident that Bitcoin will continue to follow the path of N28CT, but the good thing is, if it doesn’t, I will be ready. Analyzing data from many sources gives me the ability to be prepared for any situation.
Thanks for reading this edition of the Bitcoin Data Newsletter, again if you enjoyed, you will love my premium newsletter. I am working hard to build the community and there I analyze much more unique on-chain data, market psychology and even altcoins.
Please leave any comments or questions you have for me in the comments below, I’m always open to feedback and discussion.
Good luck to everyone on their own individual journey!
Best Wishes,
CryptoCon
Hi Cryotpcon, how do I join your telegrams group after paying for the sub