

Bitcoin Data Newsletter #2
Bitcoin Prepares Itself for the Next Leg Up

Hello followers and subscribers!
It’s finally time to dive back into the data. Bitcoin this week has made a nice recovery, moving from lows of around $50,300 to the current prices of around $59,000. The long term data is still reacting positively to this price action, with indicators either trending sideways or moving downwards to prepare for a move higher.
Currently I believe we will see a top in late May the week of the 23-29th. I think the price will range somewhere between 110k-130k at that time. The timing is based on the TD sequential, and the price on popular logarithmic models. This prediction is always subject to change based on how the data plays out, and I will update if I see it’s necessary.
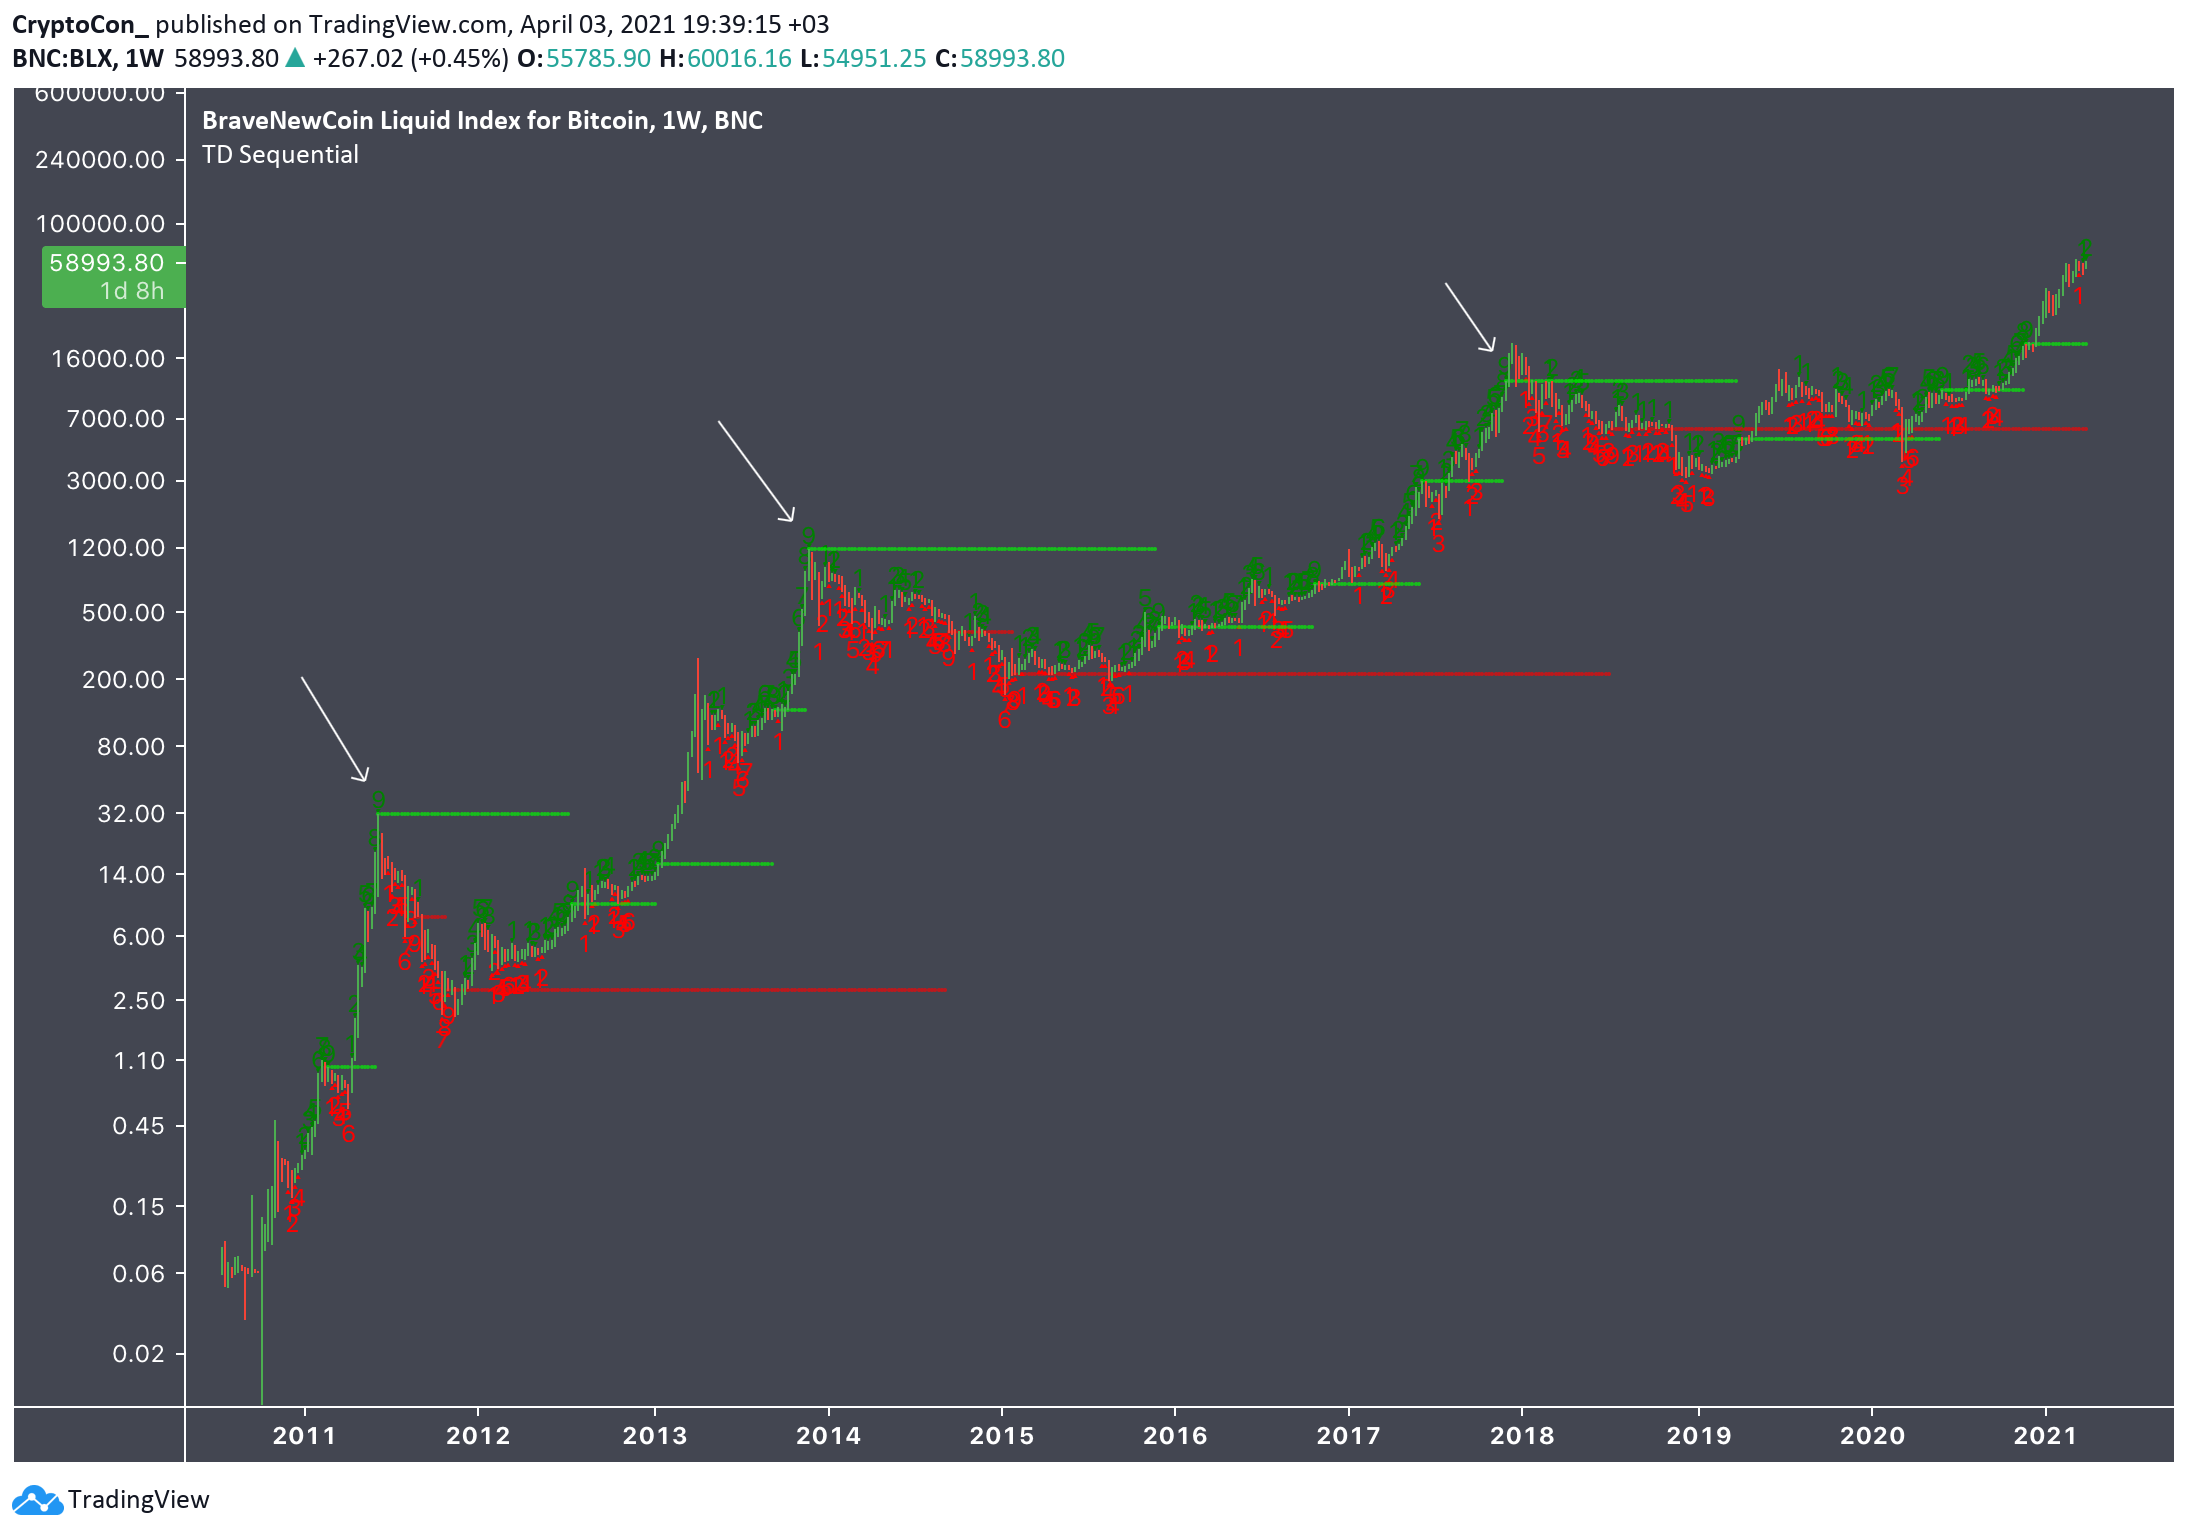
The TD sequential is usually used to determine good periods to buy and sell Bitcoin, and can be used on many different time frames. I do not suggest to use this indicator to trade, but as I have mentioned several times in my newsletters, and on Twitter, each Bitcoin top has lined up with a 9 on the TD sequential, which is the highest value. This is aside from the 2017 top that peaked 2 weeks after the 9.
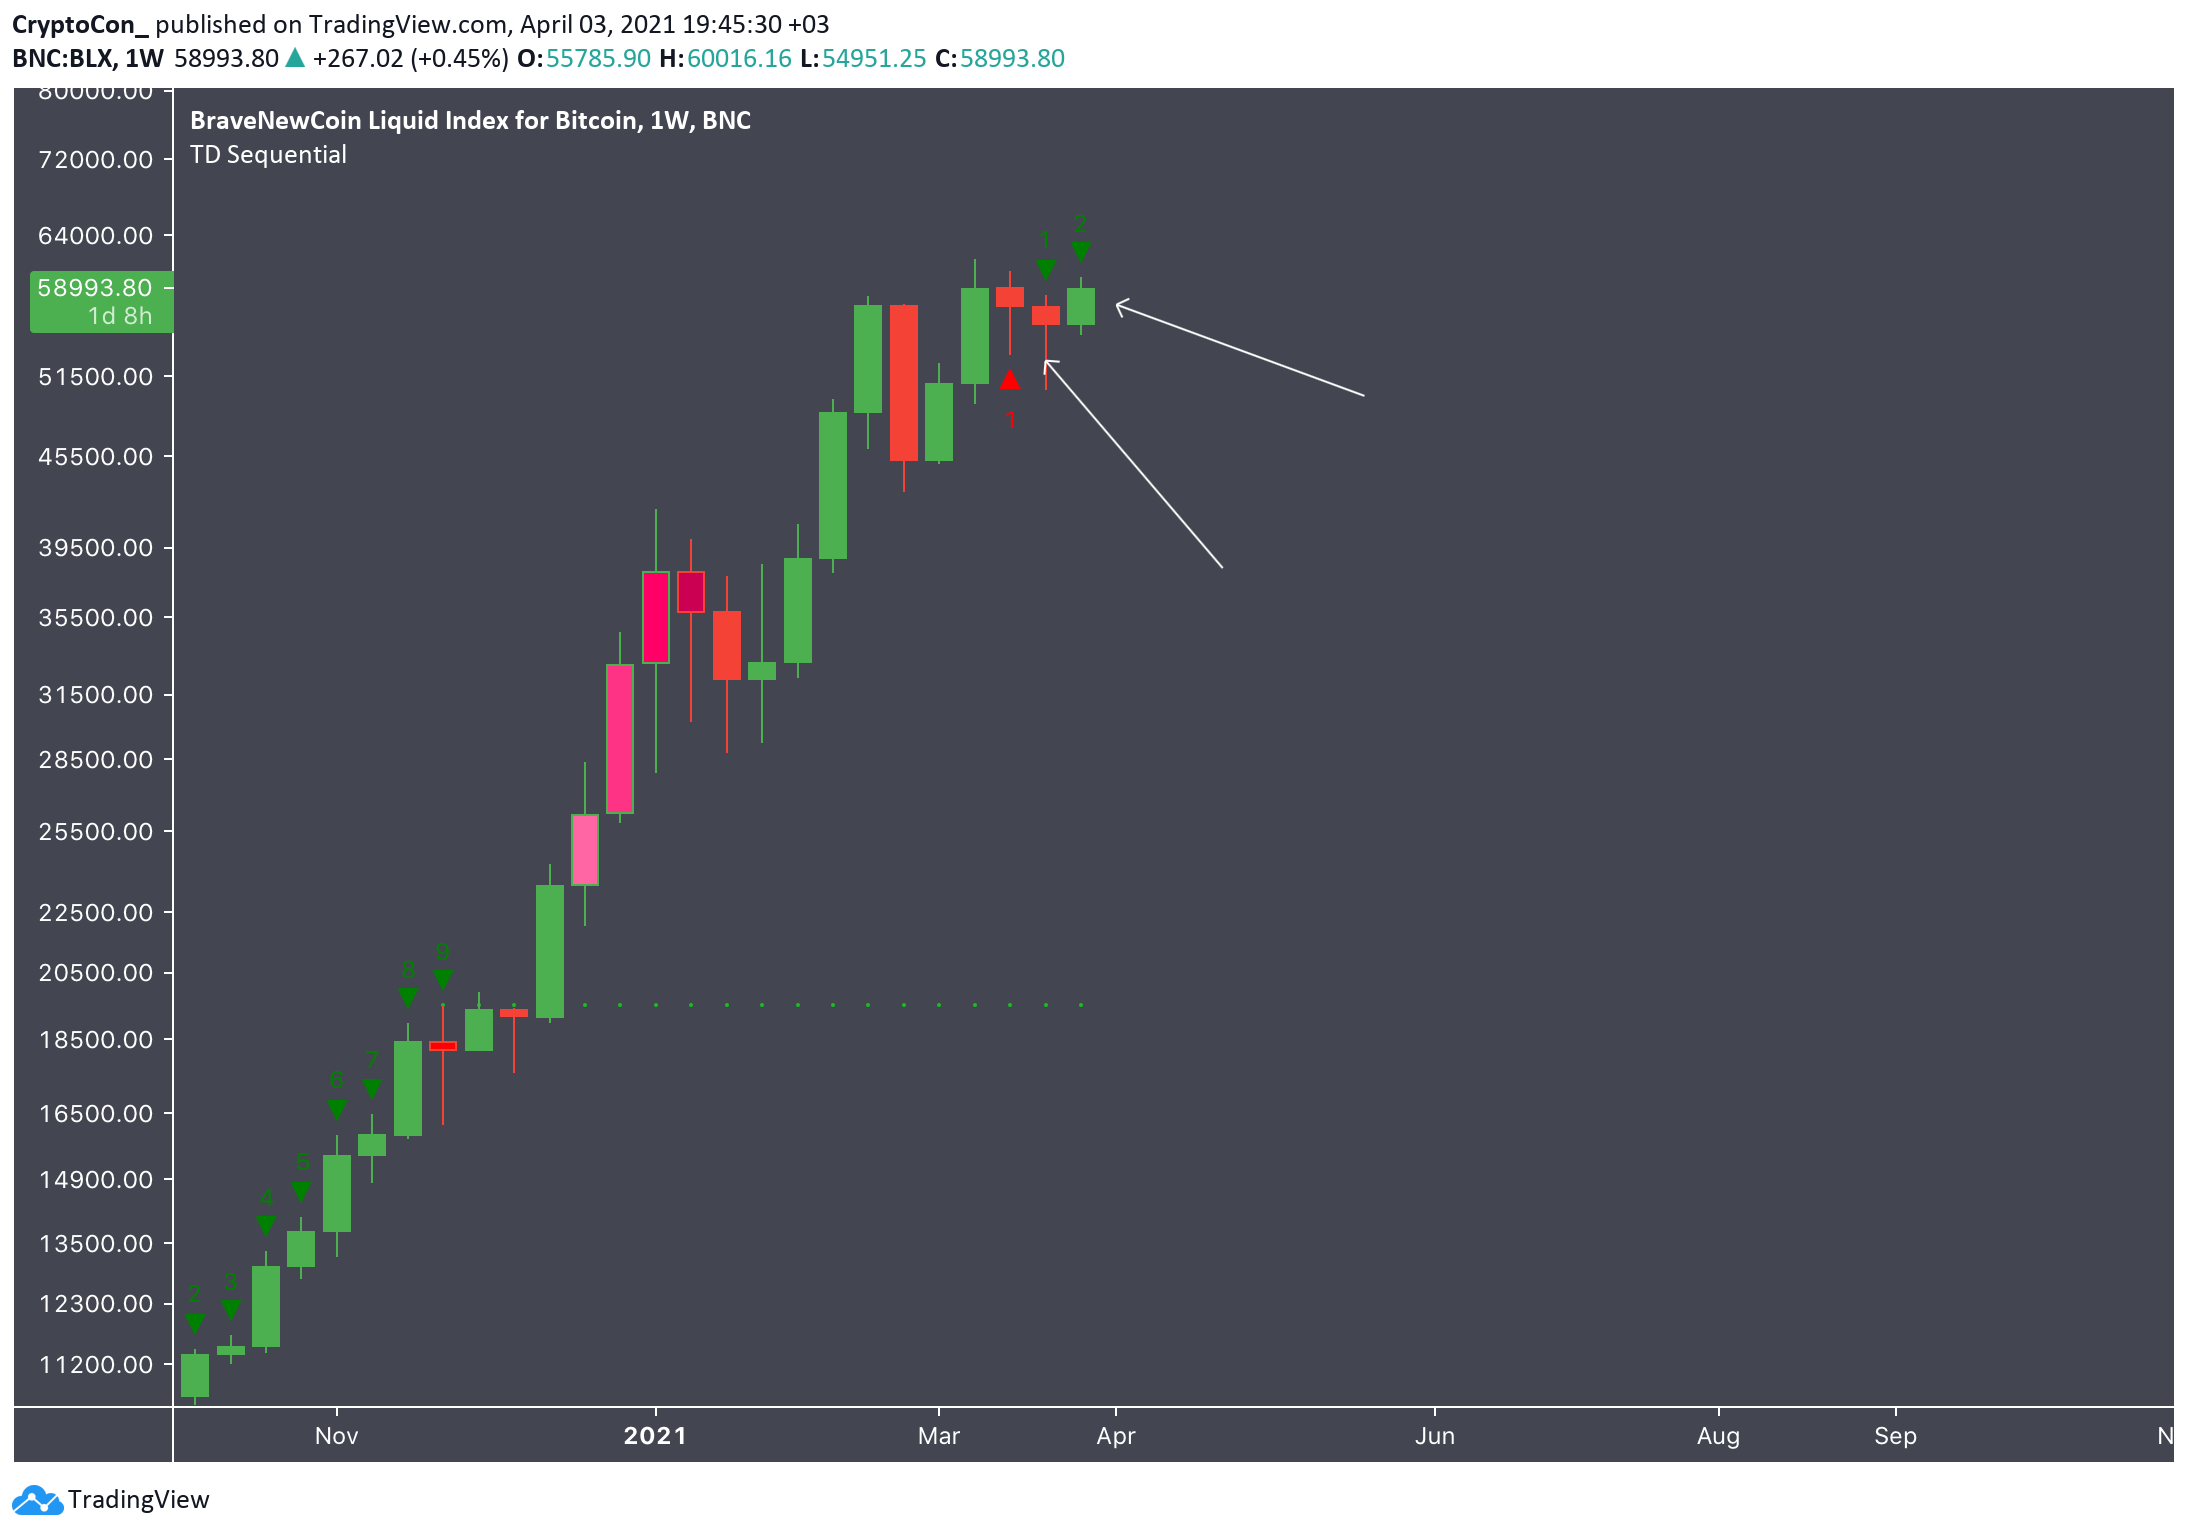
An important development has happened over the last couple weeks as for the first time in 16 weeks, the Weekly TD sequential confirmed a reset starting with the green 1. We are on track to set the green 2 this week, which would put a potential top 7 weeks from now assuming the next one lines up with a 9. This is the week of May the 23rd-29th, and that time frame lines up nicely with the placement of other important indicators.
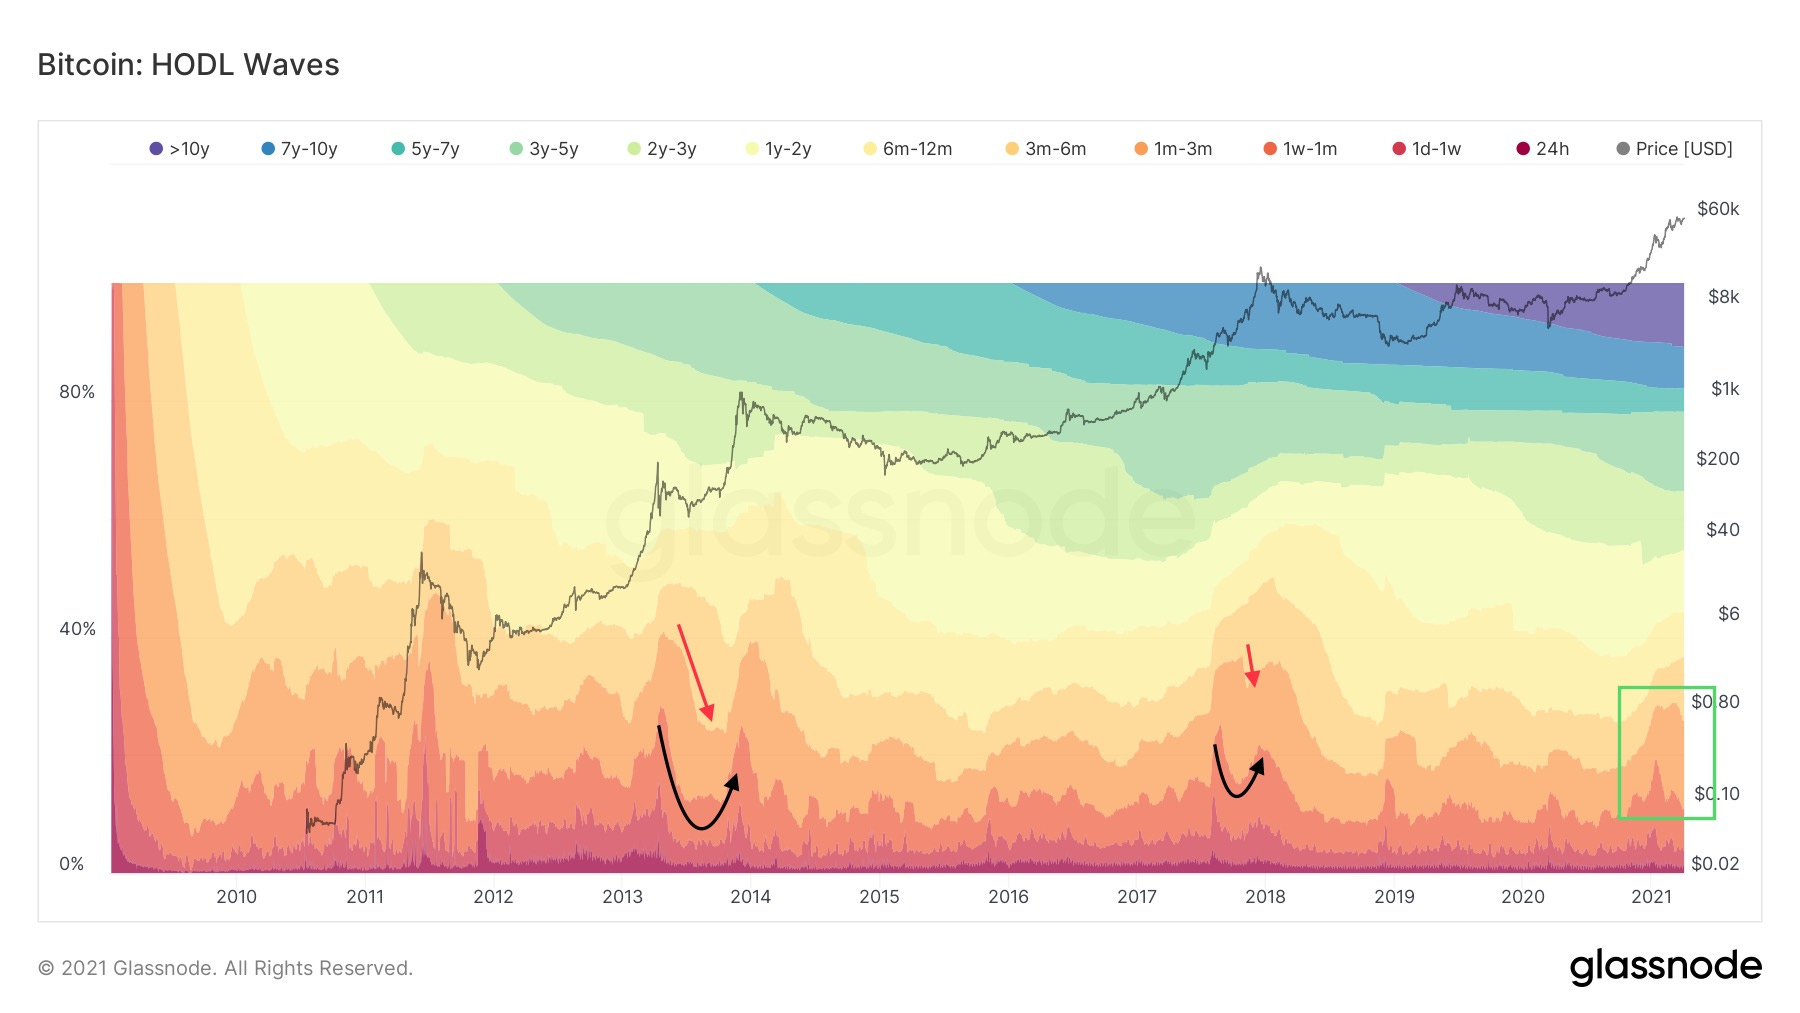
In the last Bitcoin Data Newsletter I shared a pattern I observed in the HODL waves, of a double top in the last 2 cycles, with the second wave being smaller than the first. The dips toward the bottom show HODLers accumulating, and waves to the top show selling, With the different colors being different age groups of coins.
A very important development has started to occur, which gives support to the Theory that the top could be in late May 2021.
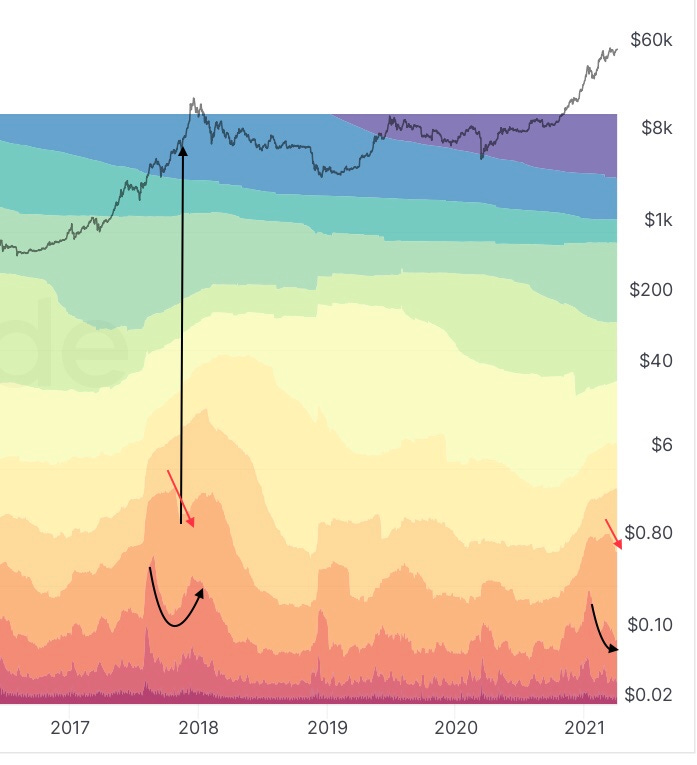
In the last cycle a dip started in the 1-3 month coin age group (red arrows) on October 24, 2017 , 2 months from the top. This was the mark of the final accumulation period, and meant that the 1-3 month coin age group were heavily buying the dip of 8k to 6k.
The age group is important, because when this 1-3 month age group started to accumulate, it was likely there would be heavy selling 1-3 months later, since that is how long this group holds their coins on average.
Last week, this dip was only developing, now it is full throttle. It is very clear that the 1-3 month coin age group is starting their accumulation phase. The drop off this time started on March 10th, so we can then assume that heavy selling will occur 1-3 months from that date.
This metric looks almost identical to 2017, and I am now waiting for a turn around point, or the valley of the bowl like shape this double top forms, which would signal to me the bull run it’s in its final phase.
If this played out identically to 2017, it would put a top in early May, but I do not think things will be exactly the same, just similar, and a top in late May would still line up perfectly with this indicator.
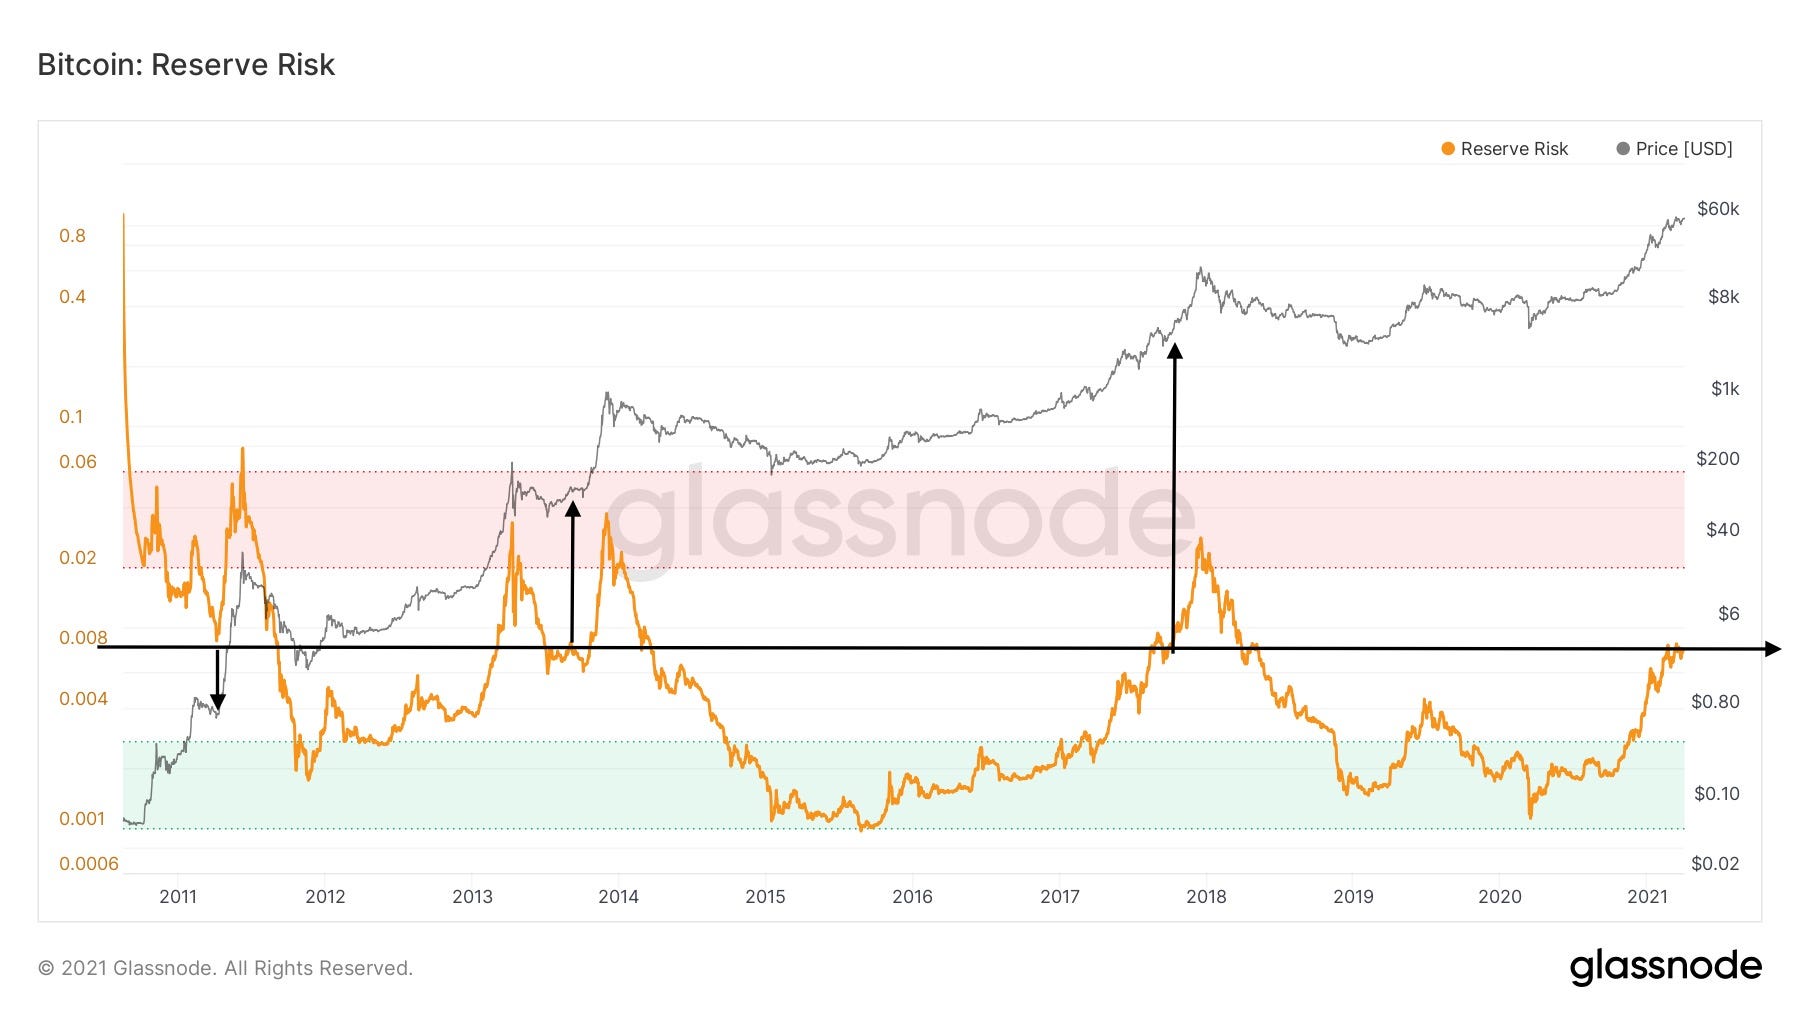
The reserve risk shows the confidence of long term HODLers, and compares it to the price. Under-confidence and over-confidence are then broken down into green and red zones showing good times to buy and sell respectively.
This indicator has been very accurate, aside from not blocking out the first 2013 “top”, regardless it’s proved itself to be very useful.
There has been a slight uptick in the metric the last week and we are currently lining up with points similar to April 2011, 3 months before the $30 top, September 2013, 2 Months before the $1,150 Top, and October 2017, 2 months before the 20k top.
On average, the reserve risk metric says we are about 2 months before the final top. Also lining up perfectly with the late May price prediction.
So, if the top does happen to be in late May as these few indicators suggest, what can we expect the price to be? For that I turn to Logarithmic models.
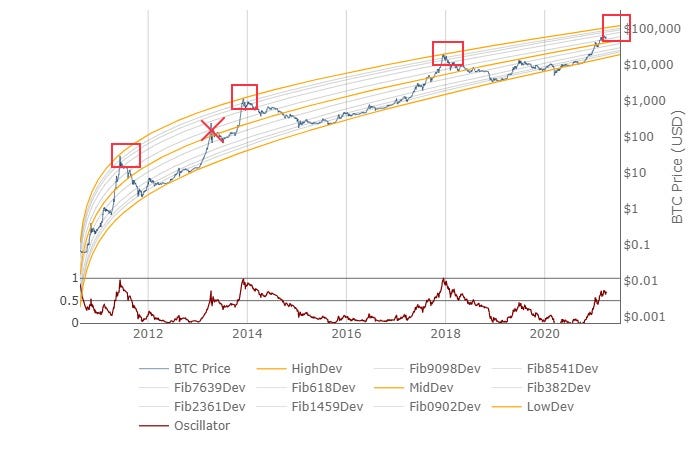
Logarithmic models are everywhere, and almost all are different, this is because the log lines are made by an mathematical equation, to fit the Bitcoin tops. Many different equations are used to try and get different prices and different levels of accuracy.
Since there are so many out there, we should turn to the ones that are most visible to people, like the one from lookintobitcoin.com. It has been very accurate the past 3 tops, and did not count the first “fake” top of 2013. With a top in late May this model shows a price of around 111k, it is possible Bitcoin could come under or over this price, but if you look closely you can see that Bitcoin has already respected these lines many times, so I expect the top to come close to 111k with any time above being short lived.
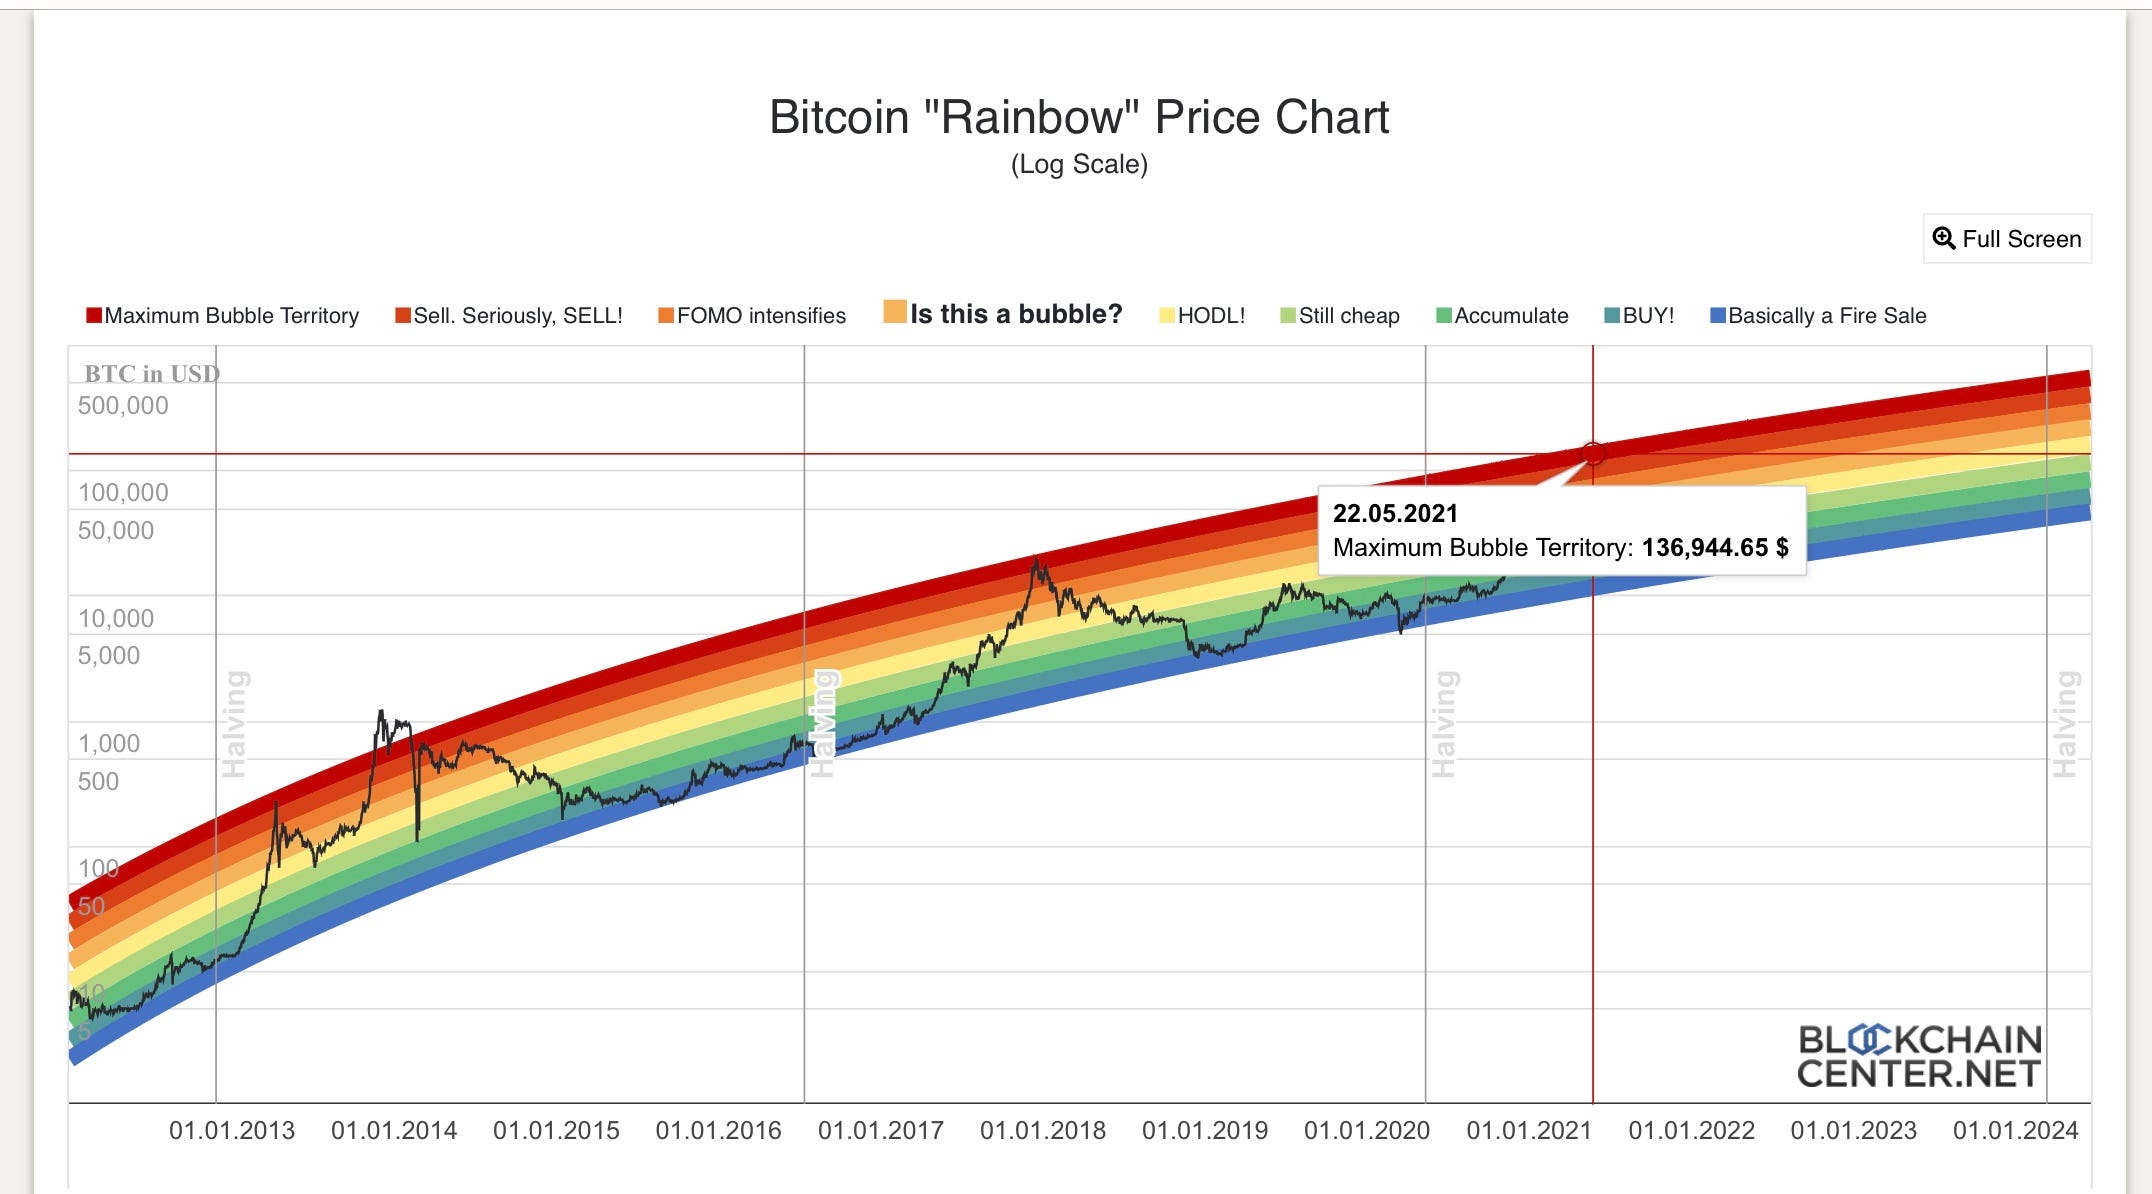
The Bitcoin rainbow chart is another widely viewed and respected log chart, the only issue with this one is that it did include the first 2013 top, and left out the first $30 macro cycle top.
This chart gives a price of approximately 137k for late May, but I do not expect it to reach that price due to the intense selling pressure that would occur if and when Bitcoin reaches the top band.
So based on this model a conservative estimate of 120-130k is made if the Bitcoin top were to come in late May.
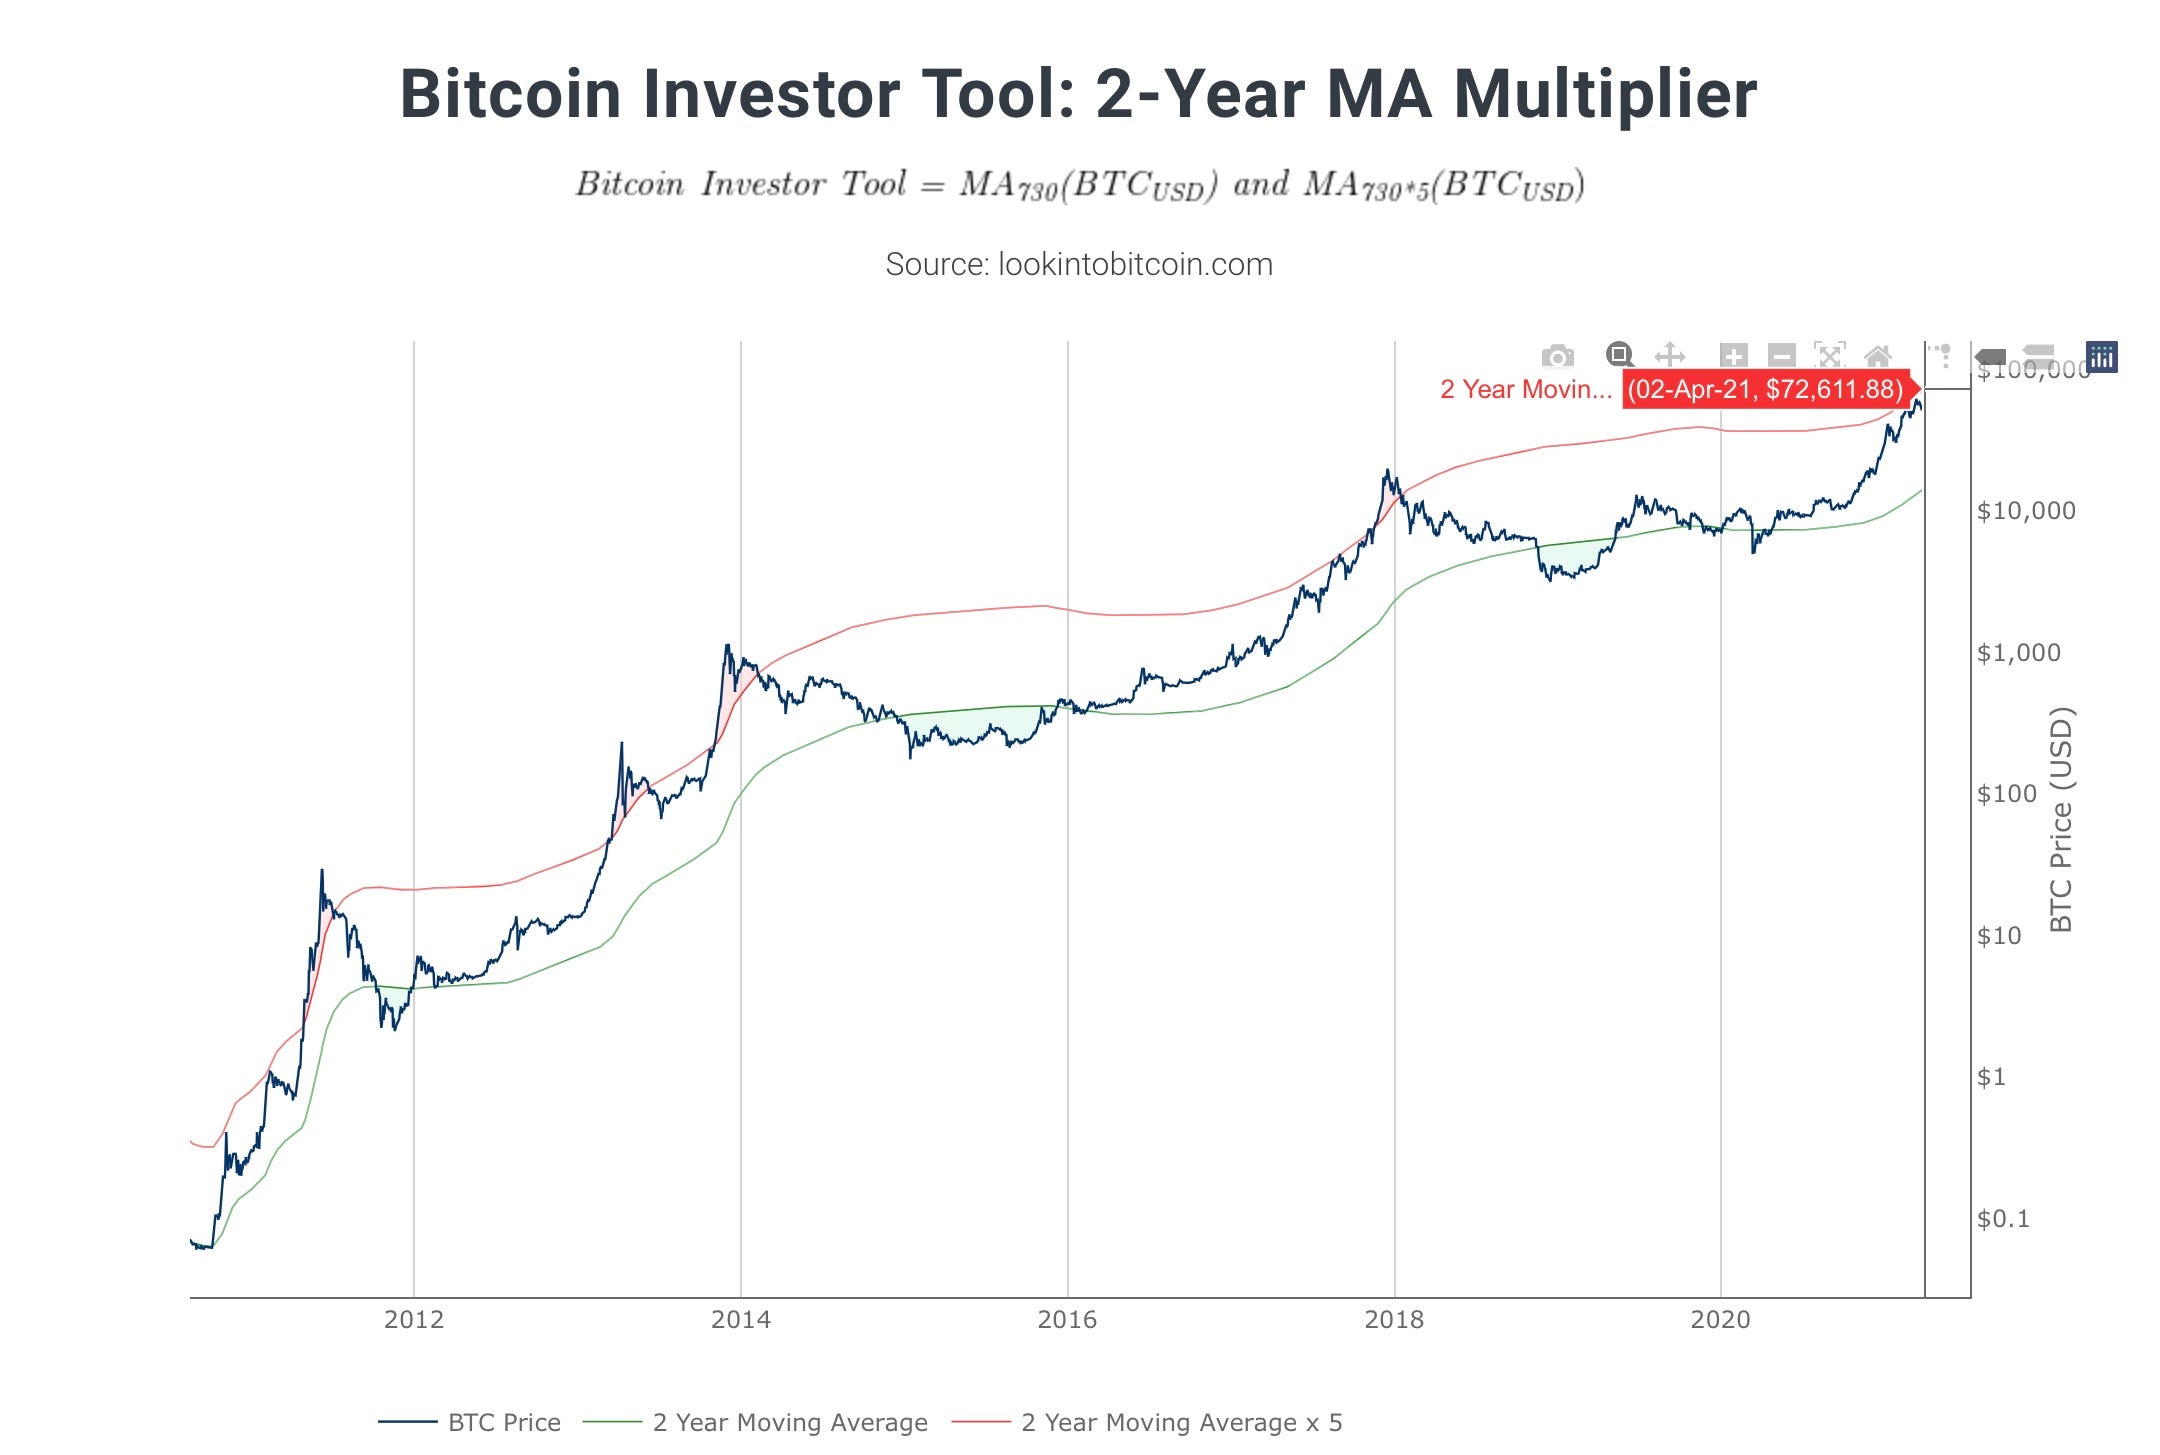
Lastly, I’ll include one of my favorite indicators, 2 Year Moving Average Multiplier. I like this one not because it calls the top, it’s obvious it hasn’t done that, but rather the the start of the final parabolic run once price crosses the red line.
Everyday the top red line increases in price as the average increases. The current top is $72,611, meaning the final parabolic run wouldn’t start until that price is breached according to this indicator.
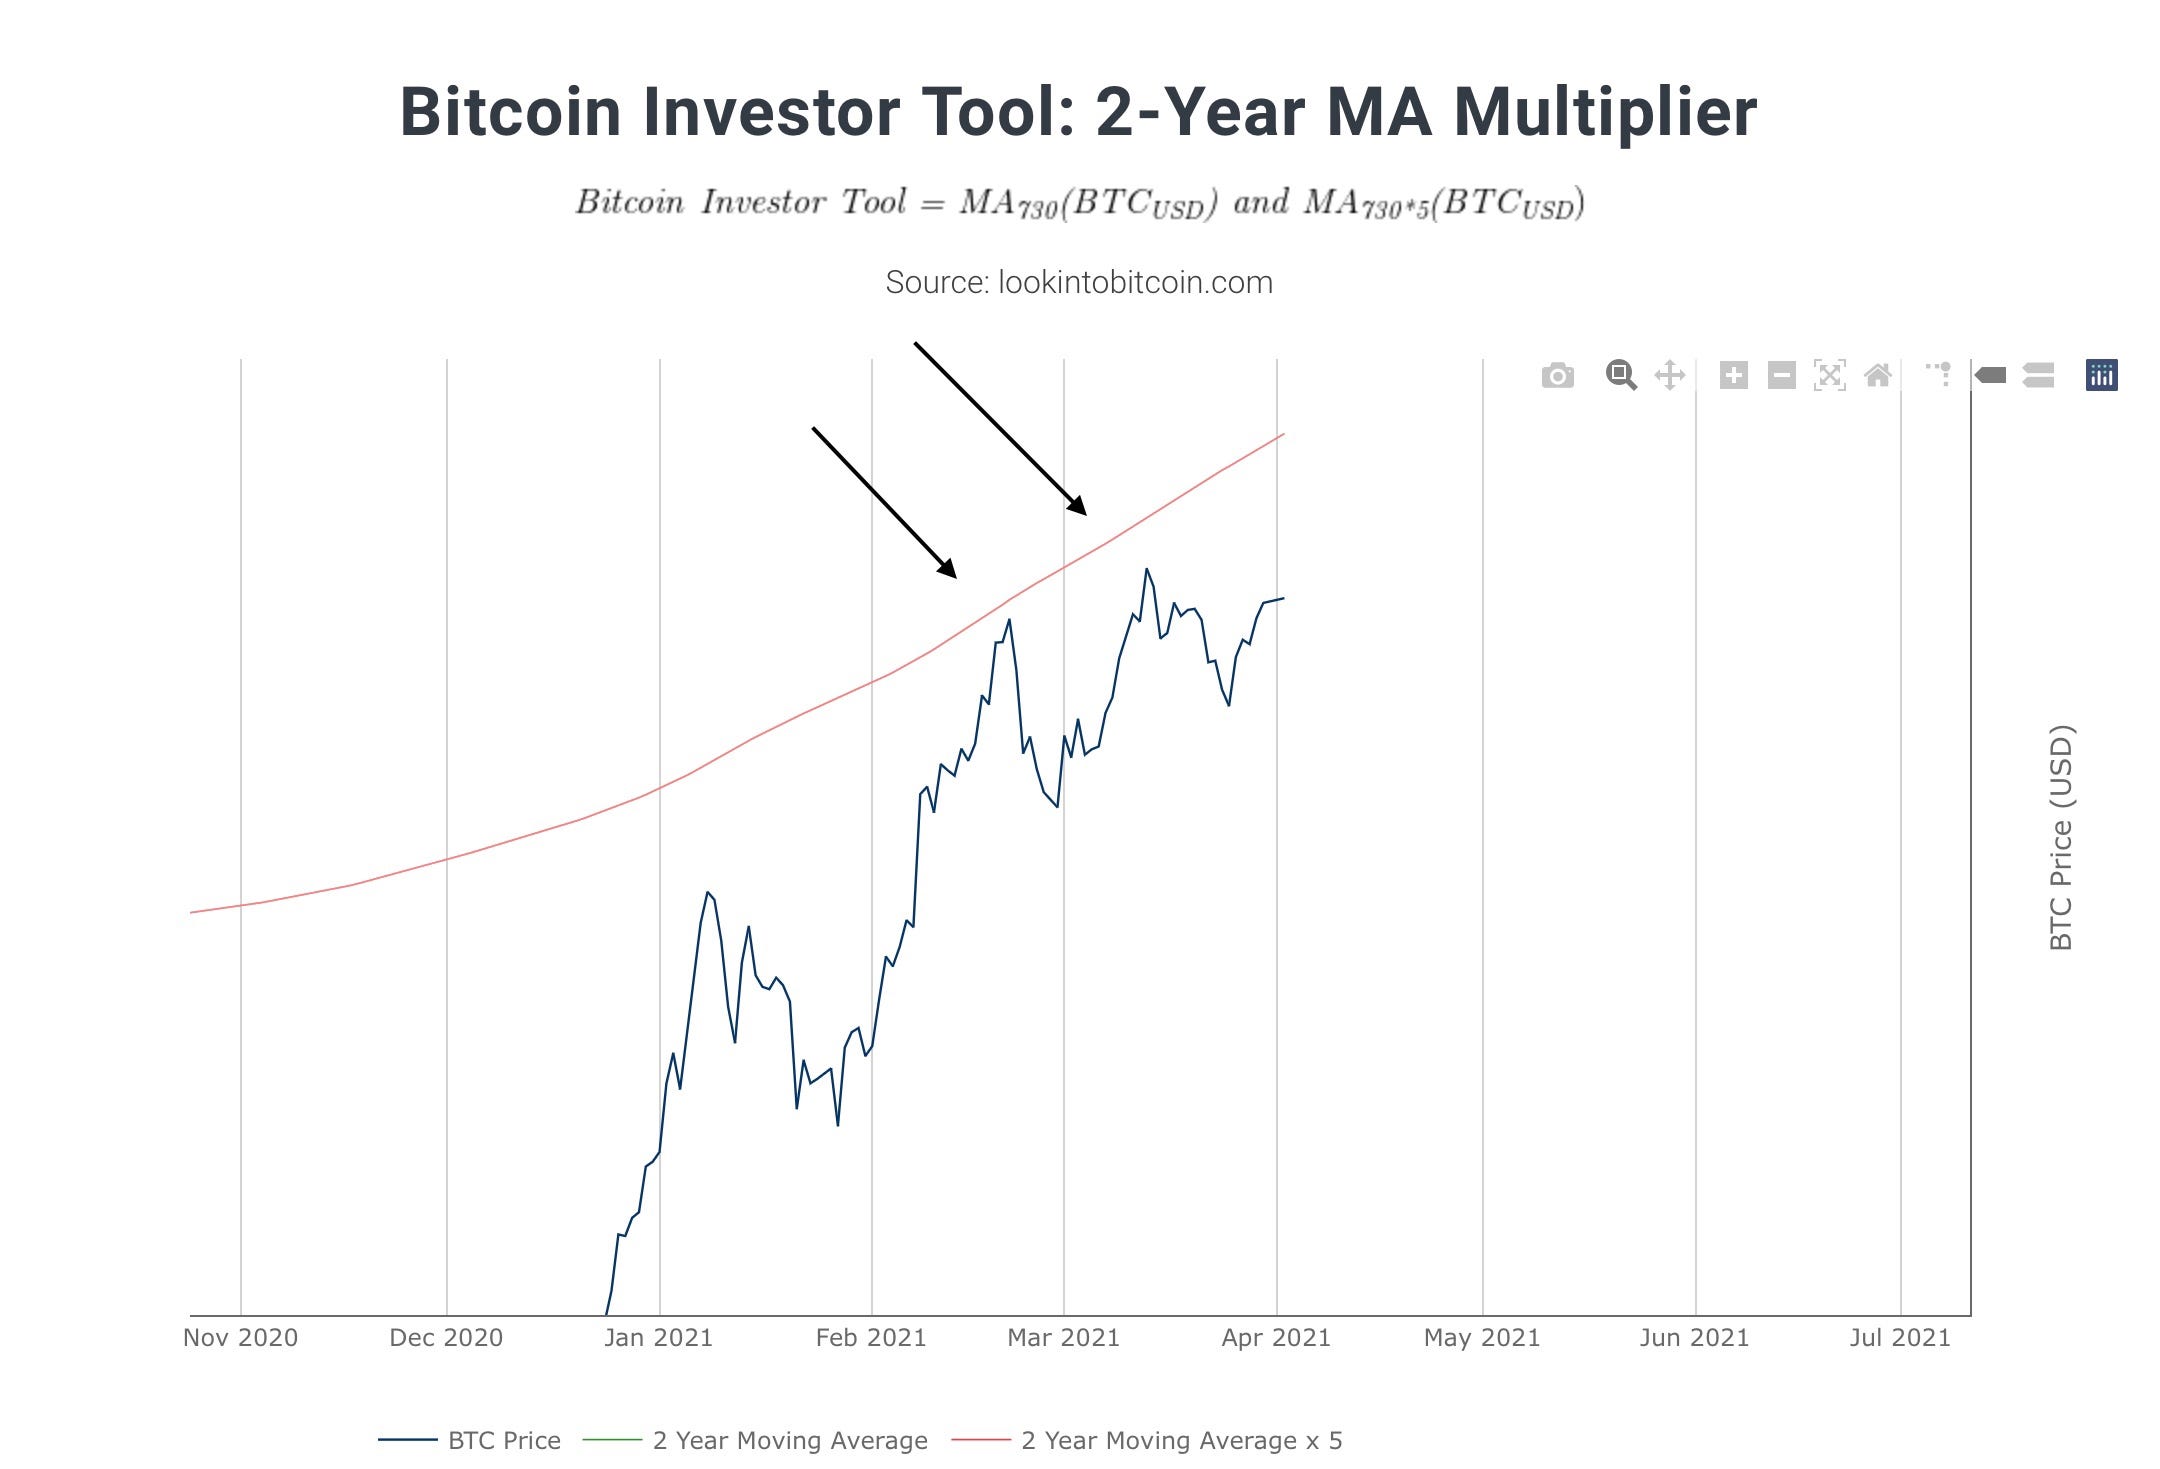
We can also see how Bitcoin has respected this line when it has interacted already, with 2 retraces in price when it gets close.
After crossing the red line the the first cycle, price did a 12.35x, the first top of 2013 a 4.87x, the second a 5.4x, and the 2017 top a 2.5x after crossing the red line.
We can see that Returns have diminished over time with this, but if the return was only 1.7x, which is considerably less than the previous 2.5x, times $72,600, which is where the red line currently tops out, would be $123,420. So even with returns reducing, it leaves plenty of room for a price target of 110-130k.
IN CONCLUSION…
Indicators like the TD sequential, HODL waves, and the Reserve Risk, can give us an idea of how close the top is in this cycle. These 3 metrics show that based on current placements, a top is likely in the week of the 23-29 of May, if Price were to continue to mimic previous cycles.
We can determine using logarithmic models, and past price returns from the 2 year Moving Average Multiplier, that the top may be around 110-130k if it were to come in May.
All of this is subject to change and based on past performance, downturns in Bitcoin price, and how fast it climbs from here will determine the accuracy of this analysis. However as time progresses my confidence grows that this is correct as more indicators confirm the same information.
Thanks for reading and hope you enjoyed! Please leave your feedback and questions in the comments here, or on Twitter. The Premium Newsletter ($15 a month) will be released tomorrow and include information on Ether, more Bitcoin data, and a possible new Pi Cycle Top indicator. If you’re not subscribed, consider subbing for free, or paid if you’d like even more information. Until next time…
HODL on,
CryptoCon