

Bitcoin, Building the Launchpad
Data Bites, Bitcoin Data Newsletter

Hello my friends!
Welcome back to Data Bites! A brief market update giving you insight to the short-term, a unique chart and my thoughts on the market.
Fear is ramping up in the crypto community, as it tends to do when price takes a drop…
I have started to get more questions about the short-term with some adamant opinions of much lower prices. In this edition of Data Bites I will focus on what’s happening with Bitcoin’s price action, talking about some of the short-term worries and cover a special long-term piece to get a better understanding of the whole picture.
Let’s dive in!
Data Bites Will Cover…
Short-Term Analysis - What’s the damage, Doc?
Market Comments - My thoughts on everyone else’s
Long-Term Look - Building the launchpad
Short-Term Analysis
What’s the damage, Doc?
You may remember the never-ending range of $30,000 and $31,000 that Bitcoin was trading in, for over one month!
As price danced on the bottom half of the range last week, I warned that maybe things weren’t looking so bullish… at least for the short term. You can visit the last Data Bites here.
Let’s go ahead and take a glance at the chart:
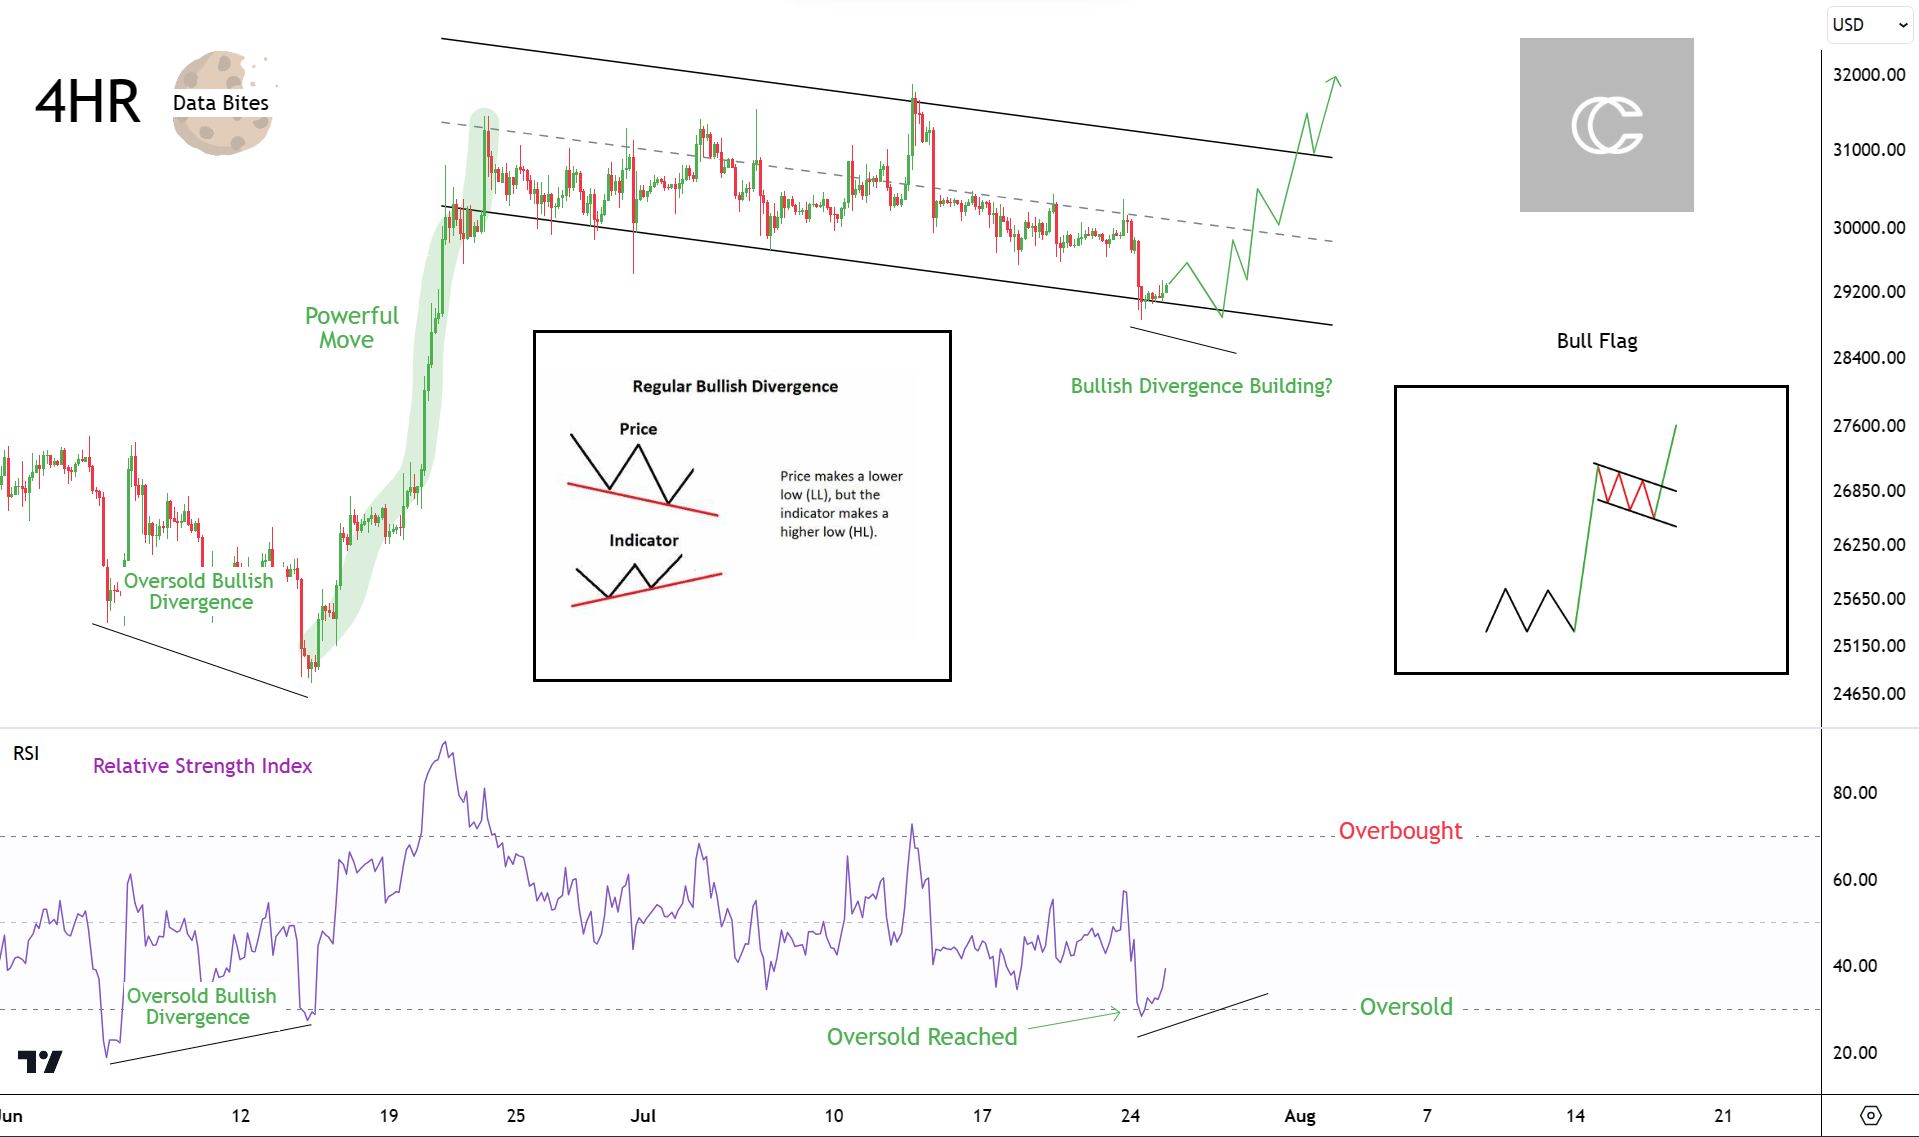
I like what I’m starting to see on the 4hr time frame. Bitcoin has gone from the horizontal channel we saw last week, to now retesting the bottom of what I would say is a bull flag. I think this is the new overarching pattern for Bitcoin.
Hope is in the air for the RSI as well, we haven’t seen an oversold bullish divergence just yet, but the metric is in that territory and now it’s starting to see an uptick, which is good! This is a step in the right direction if we want the divergence to confirm.
I highlighted the powerful move that came from the last successful oversold bullish divergence, so of course that is what I am hoping to see develop soon.
For the divergence to fully form, price needs to make a lower low. I marked a nice little green path that shows what I mean.
Overall, I don’t think there’s any solid evidence to support a confirmed turn around point, but it’s possible this the beginnings of one.
Market Comments
My thoughts on everyone else’s
Just how fearful is everyone? Not really, yet at least I think. That wouldn’t make much sense to say anyways this close to yearly highs.
As for my thoughts on much lower prices for Bitcoin… each correction has retested healthy bull market supports. You can see an example of that in this Tweet.
I keep driving this point home, if Bitcoin were parabolic then you could have an understandable concern for Bitcoin to break down through the healthy supports. That’s actually exactly what we should expect. If Bitcoin is parabolic, typically a breakdown is next. But that’s not what’s happening.
In 2015 - 2017 Bitcoin found support each time it retested the STHRP during the bull market. Only once price went parabolic at the very end of the cycle it broke to the downside. So why not expect that to be the case this time?
When you think about this way, there’s nothing to worry about.
The price of healthy supports is about $27,800, which is the most downside that I would expect to see, unless price wicks below it which is definitely possible.
Speaking of healthy bull market supports, that brings us right to the topic of our long-term observation, the Pi Cycle Top!
Long-Term Look
Building the Launchpad
There are a few metrics that can be used to determine healthy bull market pull backs. My personal favorite is the 20 Week Exponential Moving Average and another was shown above in the Twitter link, the Short-Term Holder Realized Price.
The Pi-Cycle Top indicator is famously known for calling the top precisely in April 2021, right within its scheduled window. But it has other uses that most don’t realize.
The one we’re covering today, as a healthy pull back support.
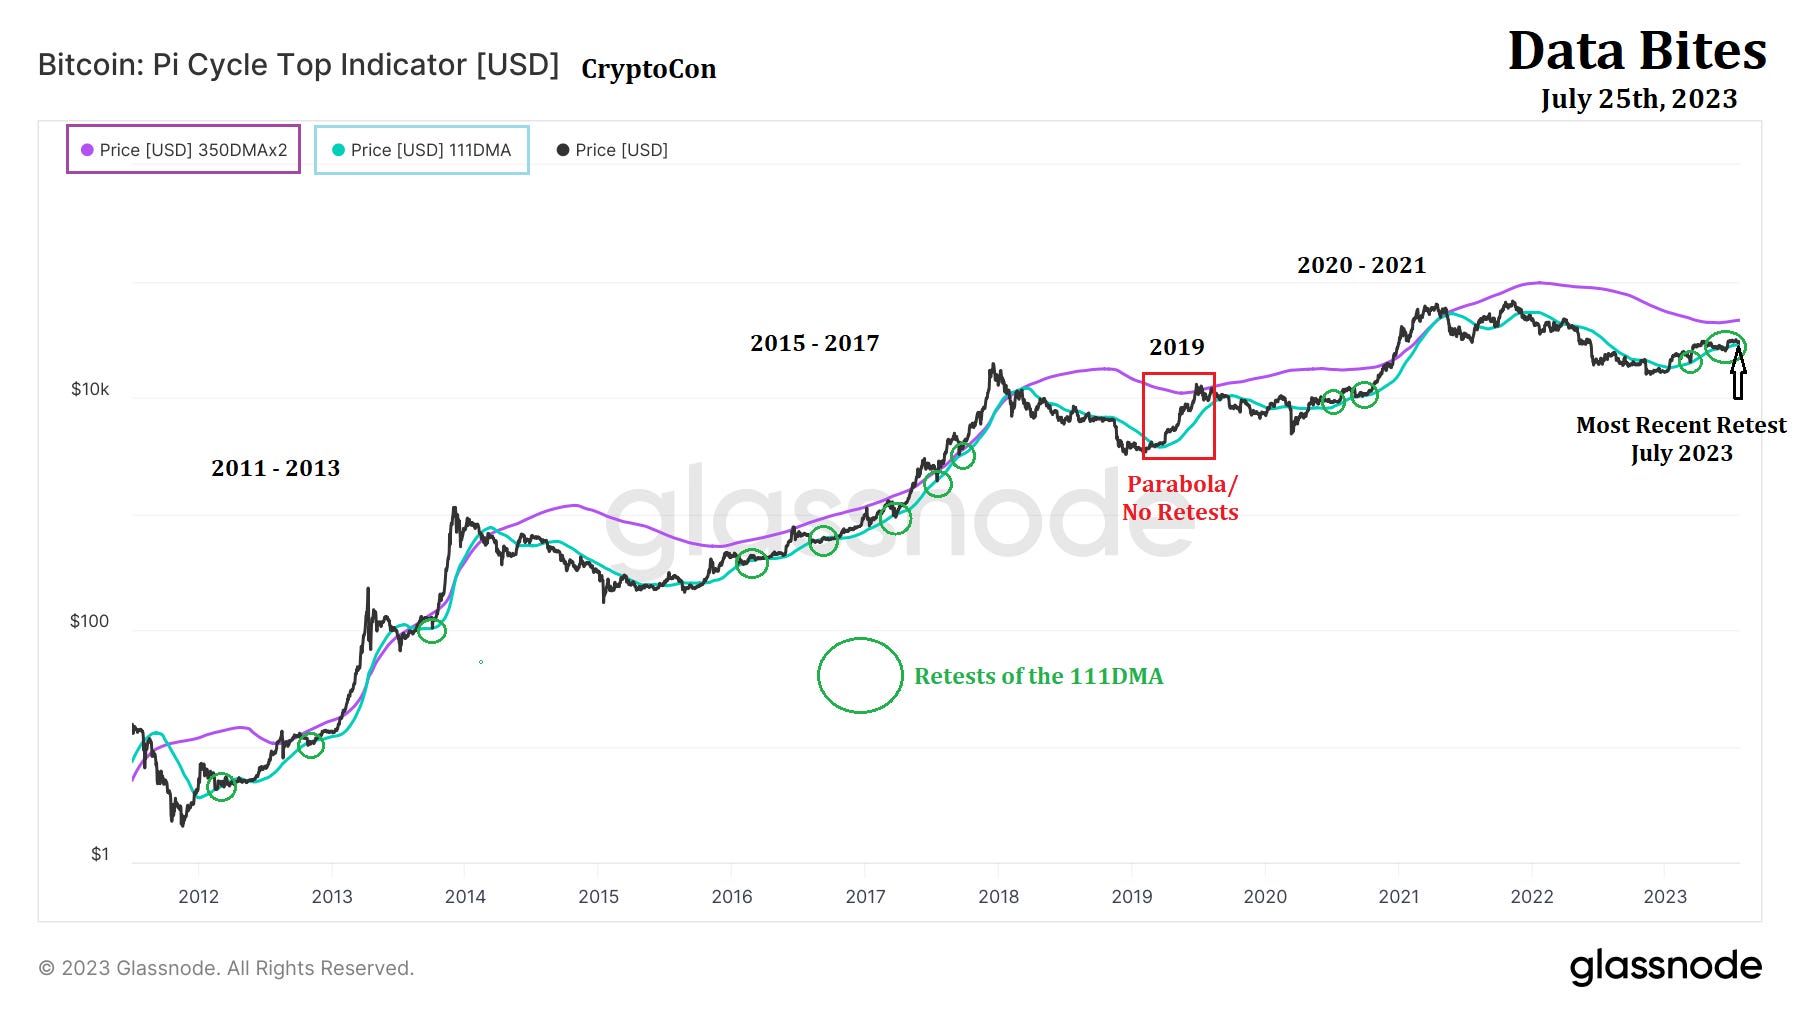
I have circled each bull market retest. The light blue line is the 111 Day Moving Average, part of the two moving averages that meld to form the Pi-Cycle Top. A cross of the two signals a market top within 3 days. Which as I said earlier, it did in real time last cycle. I saw it myself!
During the last lows of $25,000 (SEC was suing Coinbase and Binance then…), this created the largest false breakdown of what has been a very reliable indicator.
But price did manage to recover the moving average and is now hovering for a retest. The exact price of the Moving Average is $28,519.
Bitcoin doesn’t have to visit that area, but it’s possible. As we talked about earlier there is still slight room for downside.
In 2015 - 2017, there were long…. drawn out phases were price scraped along the 111DMA, but it was able to find its way back above each time, in time.
I highlighted in red the example of the 2019 parabola where there were no retests, and once price did finally decide to of course led to the mid-cycle bear market of 2019 - 2020.
I think downside is limited, and now is the time to be patient for price to build. Once it does, great things are on the horizon.
If you enjoyed this, be sure to like the post! You may also think about taking the next step in your journey, which is joining our elite group of long-term thinkers in premium. It packs a massive punch in value with all of my best work. Lengthy and extensive, exclusive analysis of Bitcoin and Altcoins and access to our group of other thinkers in the private telegram. And much more!
If any of the above sounds like it would help you, you can join us right here.
Thank you for reading this week’s edition of Data Bites! I wish you all good luck on your own individual journeys!
Best Wishes,
CryptoCon
Hey Mate, what do you think of Colin talks crypto latest video. I find it quite worrying to be honest. He is projecting a ATH within in the next 10 months before total market destruction. His video shows a few reason as why he believes this. would like to know your opinion the charts depicted in his video.
Thrilled with anticipation for the upcoming months in crypto!